

Revenue & Calc
Define the 80-place capacity, monthly school calendar, daily package prices, enrollment utilization, and program shares. The Calc schedule applies these drivers to the monthly revenue forecast.


The After-School Program Financial Model is an Excel financial planning template for an independent, school-based program. It converts available places, school days, enrollment utilization, program mix, daily prices, staffing, and operating costs into monthly calculations and a five-year forecast.
The illustrated case covers an 80-place program for children ages 6–12 in San Antonio, Texas, from 2026 through 2030. It assumes a daytime school-partner access agreement, prepaid monthly family invoices, and no transportation, summer camp, or grant revenue.
The workbook connects enrollment assumptions and operating schedules with financial statements, financing controls, and decision-oriented reports.
Define the 80-place capacity, monthly school calendar, daily package prices, enrollment utilization, and program shares. The Calc schedule applies these drivers to the monthly revenue forecast.
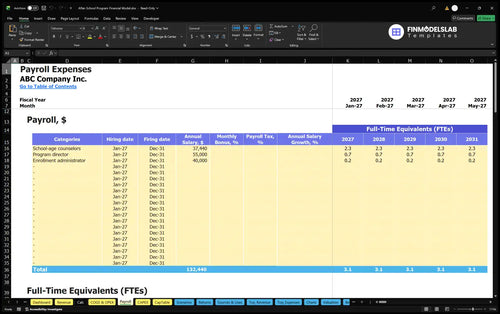
Separate supplies and processing expenses from premises overhead and role-based compensation. Payroll tracks counselor, program director, and enrollment administrator staffing without adding those salaries again to operating expenses.
Schedule startup purchases, equity contributions, and any financing facilities entered in the workbook. Debt controls on the Dashboard feed repayment schedules; the illustrated operating case does not assume confirmed outside borrowing.
Review the projected Income Statement, Cash Flow Statement, and Balance Sheet, plus a combined reporting summary. The published example below documents revenue, total operating expenses, and EBITDA, not unseen statement balances.
Use Returns for break-even, payback, and return on invested capital; Sources & Uses for cash allocation; and Valuation for discounted cash flow sensitivity when the necessary inputs are supplied.
The model calculates sales from places, operating days, utilization, seasonal enrollment patterns, mutually exclusive package shares, and daily prices.
Every booked child-day is assigned to one of five packages, rather than counted five times: Standard Care, Homework Club, STEM Studio, Arts Workshop, or Sports and Games. Their estimated daily prices are $20, $24, $28, $26, and $24, respectively.
The package shares are 40%, 20%, 15%, 15%, and 10%, producing a $23.30 weighted daily price. Annual-average utilization rises from 55% in 2026 to 75% in 2030, with capacity constrained to 80 places.
The Revenue Forecast organizes available places, child-day demand, package mix, and pricing assumptions. Its monthly calculation schedule applies the school calendar and enrollment utilization to develop projected sales by package and total program revenue.
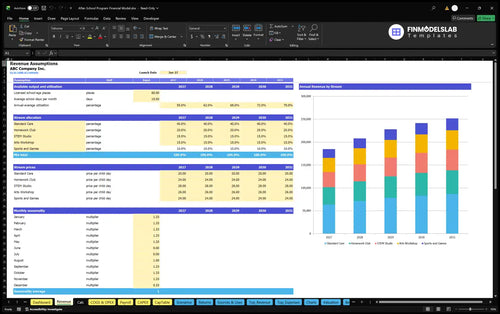
80 places × 180 annual school days × 55% utilization × $23.30 weighted child-day price = $184,536 revenue.
The normalized calendar models no child-day sales in June or July, with adjusted activity across other months. Parent invoices are prepaid each month; the case excludes additional registration fees, transportation, camps, and grants.
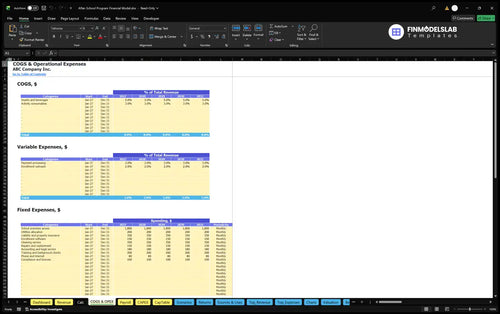
The after-school program separates revenue-linked direct costs, variable expenses, monthly fixed expenses, and role-based salaries.
Estimated direct costs are 5% of revenue for snacks and beverages plus 3% for activity consumables. Variable expenses add 3% for payment processing and 2% for enrollment outreach. Each percentage uses business revenue as its base.
Fixed overhead includes school premises access, utilities allocation, insurance, software, cleaning, repairs, professional services, background checks, communications, and compliance. Premises access is modeled at $1,800 per month for 12 paid months.
The COGS and Operating Expenses forecast groups direct, variable, and fixed items and schedules when they apply. It helps show how increased enrollment raises revenue-linked spending while recurring premises and administration costs continue through months without child-day sales.
| Expense category | 2026 cost | Main driver |
|---|---|---|
| Direct costs | $14,763 | 8% of revenue |
| Variable expenses | $9,227 | 5% of revenue |
| Fixed overhead | $42,720 | Monthly obligations |
| Payroll | $129,230 | Role-based salaries |
| Total | $195,940 | Operating expenses |
Source figures are planning projections; rounded category amounts sum to the displayed total.
The Payroll Forecast plans counselors, a program director, and an enrollment administrator with annual-average FTE assumptions and fixed base compensation. The case uses 2.34 counselor FTE, 0.65 director FTE, and 0.15 administrator FTE; payroll is not duplicated in other expense categories.
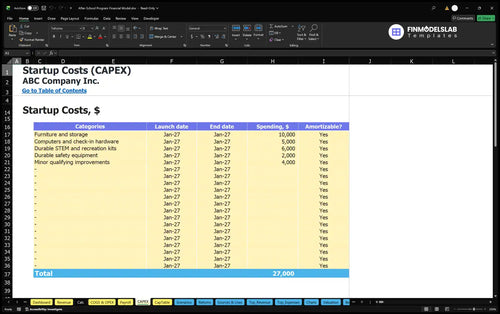
Opening assets, preopening payments, working capital, and owner contributions require funding analysis outside the annual operating expense forecast.
The selected opening asset plan includes $10,000 for furniture and storage, $5,000 for computers and check-in equipment, $6,000 for durable STEM and recreation kits, and $2,000 for safety equipment, plus minor qualifying improvements.
Other opening cash needs cover a refundable premises deposit, permits and setup, launch marketing, training and setup pay, software configuration, and initial branding. These items are kept separate from recurring operating expenses.
The Capital Expenditure Plan schedules equipment and other capital purchases, distinguishing depreciable and non-depreciable items. It links planned outlays with depreciation and asset records without treating the original cash purchase as an additional recurring payroll or operating expense.
Initial owner funding is estimated at $91,351, based on assets, distinct preopening cash items, opening inventory, and three months of recurring cash expenses. The stated scenario includes no confirmed non-owner funding.
Working-capital controls use zero accounts-receivable days, zero accounts-payable days, and 14 inventory days. These are assumptions for cash planning, not proof that the opening funding amount will cover every actual cash requirement.
The Sources and Uses of Funds report organizes equity, any entered debt, operating receipts, expenses, investment outlays, and retained cash over a selected forecast window. It helps distinguish sources of startup financing from how cash is deployed as the program operates.
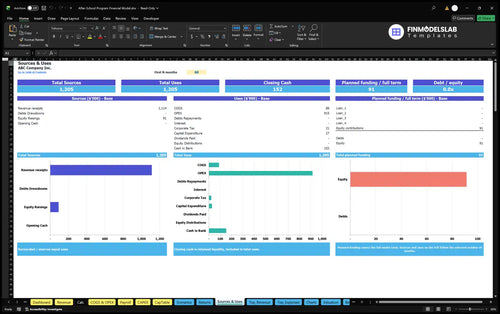
The selected base operating case shows a first-year EBITDA loss followed by positive projected EBITDA as enrollment utilization increases.
| Year | Revenue | Operating Expenses | EBITDA |
|---|---|---|---|
| 2026 | $184,536 | $195,940 | −$11,404 |
| 2027 | $208,022 | $198,993 | $9,029 |
| 2028 | $228,154 | $201,610 | $26,544 |
| 2029 | $241,574 | $203,355 | $38,220 |
| 2030 | $251,640 | $204,663 | $46,977 |
Illustrative planning projections, rounded to whole dollars; displayed totals may differ slightly because of rounding.
In this base case, enrollment growth changes annual EBITDA from an initial loss to a projected $46,977 surplus by 2030.
These figures describe performance through EBITDA only. They are not net profit, free cash flow, observed results, or proof of cash sufficiency; interest, taxes, depreciation, capital spending, and financing can materially change those outcomes.
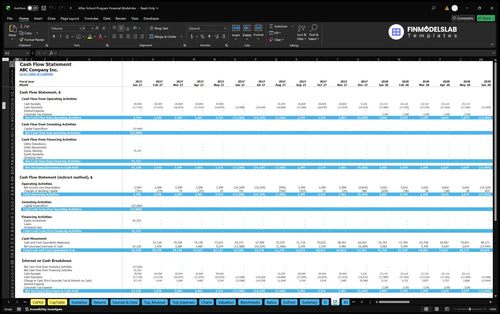
The Cash Flow Forecast tracks expected operating, investing, and financing cash movements and reconciles opening to closing cash. Use it to assess the timing of prepaid family receipts, summer cash obligations, startup spending, and owner contributions beyond the EBITDA projection.
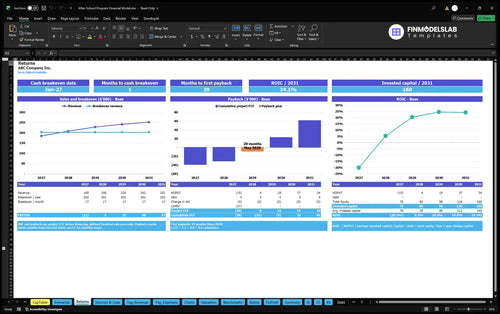
Return and scenario reports help test the sustainability of enrollment assumptions without claiming a specific investment return for this example.
The Returns report distinguishes operating sales break-even from cash break-even, investment payback, and annual return on invested capital. Sales needed to cover operating costs are not the same as accumulated cash recovery of startup investment.
The Returns report compares sales against break-even requirements and evaluates project cash-flow recovery, investment payback, and annual ROIC. It helps an operator ask whether projected enrollment, ongoing costs, and required initial investment produce an acceptable financial outcome.
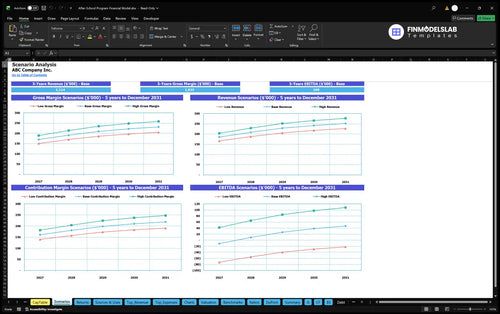
Dashboard scenario controls let a buyer compare Low, Base, and High multipliers for revenue, direct costs, variable expenses, fixed expenses, and payroll. For a school-year operation, this can test slower enrollment, staffing pressure, or stronger package demand.
The Financial Scenario Analysis compares Low, Base, and High outcomes for revenue, gross margin, contribution margin, and EBITDA. It makes the effect of selected operating multipliers easier to inspect before choosing staffing levels, enrollment targets, or a funding strategy.
These answers explain the model scope and the difference between its inputs, financial projections, and reporting capabilities.
Yes. Adjust places, utilization, school-day assumptions, package prices, and mutually exclusive package shares in the revenue inputs.
No. The illustrated operating case has no June or July child-day sales and excludes summer camps, transportation, grants, and registration fees.
Counselors and other roles are planned on Payroll using annual-average FTE and salary assumptions, with salaries excluded from direct, variable, and fixed expense categories.
No. The documented illustrative results stop at EBITDA; net profit, depreciation, financing cash flows, and tax outcomes should not be inferred from those figures.
Yes. Cash Flow and Balance Sheet are declared workbook reports, but the published example does not provide their calculated balances.
Yes. The Returns report supports break-even, investment payback, and annual ROIC analysis; this example does not establish specific payback or ROIC values.
No. It is an estimated opening funding assumption; review startup spending, collections, seasonal cash needs, and financing with the full model.
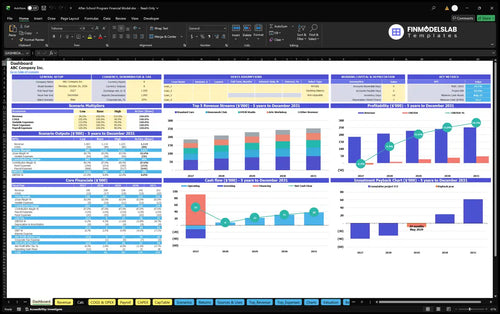
KPIs, forecasts, and cash flow at a glance.
Key assumptions and calculations driving revenue forecasts.
Funding sources, spending, and closing cash.
Cash break-even, payback, and ROIC.
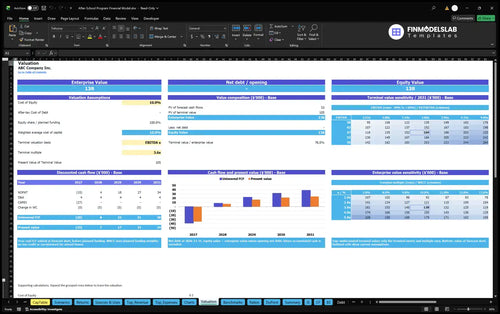
DCF valuation and sensitivity analysis.
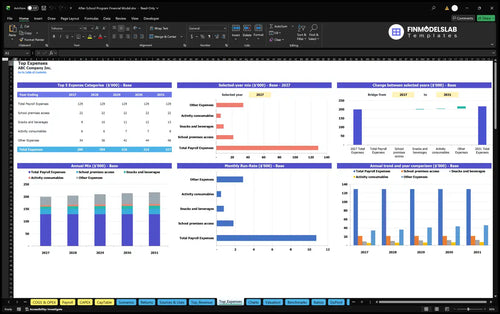
Largest costs and spending trends.
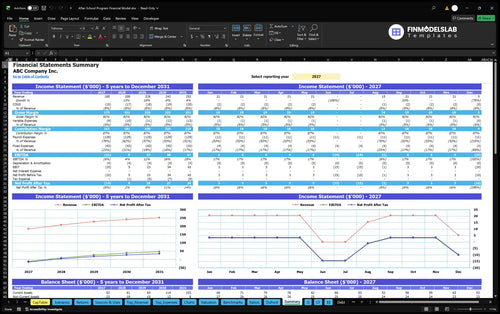
Annual and monthly financial performance.
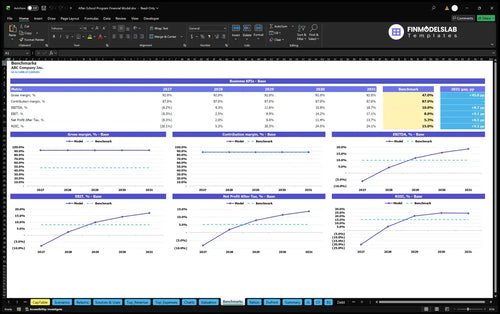
Compare margins and returns to benchmarks.

One broken formula used to throw off my whole sheet, but this template kept the logic clean and easy to trace. I saved about 4 hours of fixing errors and could trust the numbers again.
My statements and charts were spread across too many files, so reporting took forever. This template brought everything into one workbook and cut my monthly update prep by half a day.
I could finally see margins and break-even without digging through messy tabs. That clarity helped me make a pricing call and prepare for a meeting in one afternoon.