

Product lines
Set manufactured extrusion product lines and launch timing used by the forecast.


This editable Excel and Google Sheets workbook forecasts five years of aluminum extrusion product-line revenue from units and prices, with monthly and annual statements plus scenarios.
Use the workbook to translate extrusion product volumes, unit pricing, seasonality, direct costs, staffing, capital spending, and financing assumptions into a five-year financial plan.
Revenue and operating inputs feed the calculation engine, which carries assumptions into monthly and annual statements, Low/Base/High comparisons, dashboard metrics, and supporting reports.
The model multiplies units produced for each extrusion product by its sales price, applies monthly seasonality once, then sums enabled product lines and ancillary revenue.
Set manufactured extrusion product lines and launch timing used by the forecast.
Enter units produced by product and period under the model’s production-based sales convention.
Assign the matching sales price per unit for each enabled product line.
Apply the seasonality schedule once to annual inputs and include enabled ancillary revenue.
Calculate each product line and sum all enabled product-line and ancillary revenue.
The Revenue sheet links extrusion product names, launch dates, units produced, sales prices, and monthly seasonality to the product-line revenue forecast.
 REVENUE
The OPEX sheet separates variable and fixed operating expenses, with timing and periodicity inputs that feed monthly expense projections.
 OPEX
The Scenarios sheet compares five-year Low, Base, and High paths for revenue, gross margin, contribution margin, and EBITDA.
 SCENARIOS
The Dashboard combines setup controls, scenario selection, headline financials, revenue mix, profitability, cash flow, and investment-payback visuals in one view.
 DASHBOARD
This ready-made model fits extrusion manufacturers selling product lines from unit volumes and prices; structurally different revenue logic or reporting may require custom modeling.
The template is a planning starting point, not a guarantee of performance.
Financial Models Lab can build or adapt a model when your requirements call for different revenue logic, operating schedules, or financial reporting.
ORDER A CUSTOM FINANCIAL MODELAfter checkout, you receive the editable five-year aluminum extrusion financial model for Excel and Google Sheets with monthly and annual reporting and scenario analysis.
Use the financial model in Microsoft Excel or Google Sheets and replace editable assumptions with your own inputs.
Review five forecast years with monthly and annual financial statement detail.
Compare Low, Base, and High cases through the model’s scenario framework.
Review the income statement, cash flow, balance sheet, dashboard, and supporting analysis.
The essential answers are visible in full, with no accordion clicks required.
Revenue is calculated by product line from units produced and matching sales prices, with annual inputs allocated by seasonality and enabled ancillary revenue added.
You can edit product-line names, launch dates, units produced, unit prices, monthly seasonality, and enabled ancillary revenue assumptions.
The Scenarios view compares Low, Base, and High cases across revenue, gross margin, contribution margin, and EBITDA over the five-year forecast.
The workbook includes the income statement, cash flow statement, balance sheet, Dashboard, Scenarios, Summary, and supporting analysis views.
Yes. Financial Models Lab can build or adapt a model when different revenue logic, operating schedules, or reporting is required.
It is a planning forecast based on editable assumptions, not a guarantee of business performance or financial results.
You receive a comprehensive and user-friendly financial model that includes a dynamic dashboard, detailed financial statements, and robust assumption sheets to plan your aluminum extrusion business.

Core inputs and core outputs

Three scenario analysis

Presentation ready
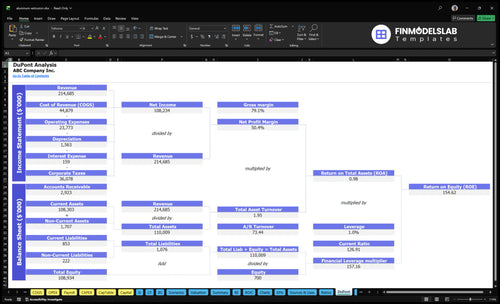
DuPont analysis
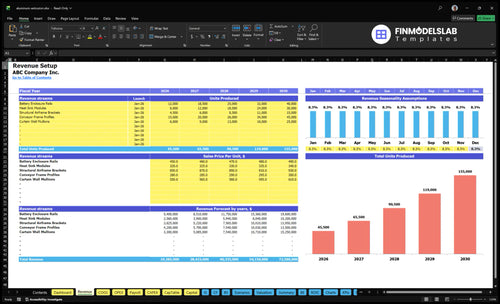
Researched revenue assumptions

Lender-friendly financial outputs
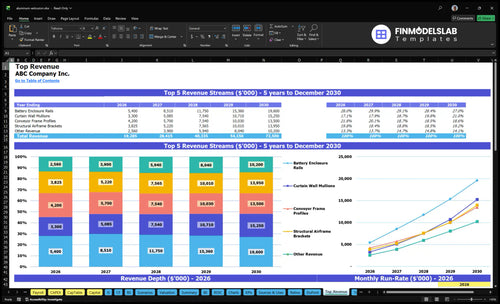
Revenue stream detailed view

Performance metrics benchmark

This template made profitability easier to read, with margins and break-even shown in one place instead of buried in assumptions. It saved me hours of guesswork when I reviewed pricing for our extrusion runs.

I was tired of piecing together statements and charts from different files. Now everything is in one model, and I could send a clean update to our team in under 15 minutes.
Building the financials by hand was taking too long, and this template cut that work down fast. I had a usable first pass for our planning meeting the same day.