

Revenue & Calc
Enter customer purchases per trading day, basket units, category shares, prices, and opening date. Monthly Calc formulas allocate one retail-unit pool across six categories before consolidating sales.


The Asian Grocery Store Financial Model is an Excel planning template for a neighborhood pan-Asian supermarket. It translates editable checkout demand, merchandise-category pricing, landed inventory costs, store expenses, and staffing into monthly calculations and annual financial projections for 2026 through 2030.
The illustrative case models a 3,000-square-foot independent store in suburban Dallas-Fort Worth, Texas, launching January 31, 2026. It covers packaged staples, noodles, sauces, produce packs, snacks, and frozen or chilled foods, without a kitchen, fresh meat counter, alcohol sales, or delivery.
The workbook connects editable grocery-store operating assumptions to supporting schedules, financial statements, and decision reports.
Enter customer purchases per trading day, basket units, category shares, prices, and opening date. Monthly Calc formulas allocate one retail-unit pool across six categories before consolidating sales.
Plan merchandise costs, inventory shrink, checkout fees, store occupancy, maintenance, and staff roles separately. Payroll links planned full-time equivalents and compensation to personnel expense.
Schedule fixtures, refrigeration, improvements, and other assets. Record equity contributions and, if desired, financing structures and repayment assumptions through the dedicated debt controls and schedules.
Review the Income Statement, Cash Flow, Balance Sheet, Dashboard, scenario comparisons, funding analysis, break-even and Returns reports. Checks help identify reconciliation or input issues.
Sales are calculated from purchases per open day, the number of open days, six retail units per purchase, category unit shares, and selling prices.
The 2026 base case assumes 95 purchases per open day, 30 open days monthly, and six units per purchase. That yields 17,100 retail units per normal month, not 17,100 transactions. Demand rises to 160 purchases per day by 2030.
Category allocation is 18% rice and dry staples, 20% noodles, 16% sauces, 16% produce packs, 16% snacks and beverages, and 14% frozen and chilled foods. Shares describe units, not revenue shares; each unit receives its own editable category price.
The Revenue Forecast links daily customer demand, trading days, basket size, product-category shares, and selling prices to monthly and annual grocery sales. Adjusting one assumption changes the matching sales stream rather than multiplying the same retail units across categories.

95 purchases/day × 30 days × 6 units × $4.72 weighted unit price = $80,712 in monthly revenue.
Prices are $6 for staples, $3 for noodles, $5 for sauces, $4 for produce packs, $3 for snacks and beverages, and $8 for frozen and chilled products. The weighted six-unit basket equals $28.32; twelve normal months produce the illustrated 2026 revenue of $968,544.
The single launch date switches all categories from zero to a full normal month at launch. Annual revenue sums monthly sales, and the documented base case does not apply a seasonal demand pattern.
Operating expenses separate merchandise economics, sales-linked charges, monthly store overhead, and paid personnel so salaries are not double-counted.
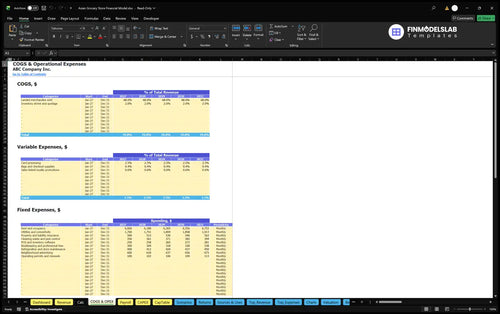
Direct COGS consists of 68% of sales for landed merchandise and 2% for shrink and spoilage, totaling 70%. Variable expenses add 2.5% processing, 0.4% bags and checkout supplies, and 0.6% loyalty promotions, totaling another 3.5% of sales.
Fixed spending covers rent, utilities, insurance, cleaning, software, bookkeeping, refrigeration upkeep, advertising, and operating renewals. In the case, monthly rent starts at $6,000 in 2026 and reaches $6,753 in 2030, with twelve paid months per year.
The COGS and Operating Expenses Forecast separates merchandise purchase and shrinkage rates from card fees, checkout materials, promotions, and recurring store costs. Its monthly calculations feed the expense categories used to evaluate gross, contribution, and operating margins.
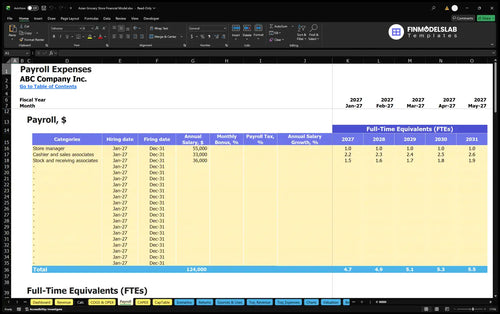
The staffing plan includes one store manager at $55,000 annual base pay, cashier and sales associates at $33,000 per FTE, and stock and receiving associates at $36,000 per FTE. Cashier FTE increases from 2.2 to 2.6; stock FTE from 1.5 to 1.9.
These are annual-average full-time equivalents rather than rounded headcounts. The source case excludes employer payroll taxes, benefits, and personal taxes; payroll expense is separate from COGS, variable expenses, and fixed store overhead.
The Payroll Forecast organizes store-manager, checkout, and stock-receiving labor by role, FTE plan, pay, and employment timing. Its personnel calculations support testing staffing levels against customer throughput and the EBITDA effect of hiring decisions.
Opening investment and cash funding are modeled separately from the ongoing revenue and expense forecast.
The example identifies $35,000 of refrigerators and freezers, $20,000 of shelving and fixtures, $45,000 of leasehold improvements, and $7,000 of POS, security, and office equipment. These $107,000 of startup assets are distinct from ongoing store expenses.
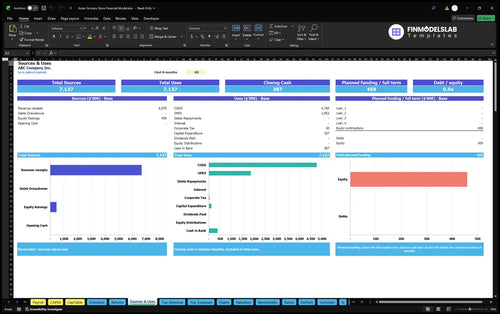
Other opening cash requirements include lease and utility deposits, permits and setup, initial marketing, training and stocking labor, insurance, and prepaid inventory. The illustrative initial owner funding is $459,482, including a planned three-month operating-outflow reserve.
The Capital Expenditure Plan schedules asset purchases and tracks the depreciation treatment of eligible equipment and improvements. It helps distinguish refrigeration, shelving, and store-build costs from the recurring expenses that drive operating EBITDA.

The case assumes zero receivables days because checkout customers pay immediately, seven days of supplier payables, and 35 days of inventory. These editable working-capital controls help connect inventory investment and supplier timing to financing needs; they do not establish that cash is sufficient.
The Sources and Uses of Funds report organizes equity, any modeled debt, operating receipts, store purchases, and other cash allocations. It allows buyers to examine the funding mix without treating initial owner contributions as sales or EBITDA.
The example increases daily purchases over five years, while modeling the costs and staffing needed to serve that demand.
| Year | Revenue | Operating Expenses | EBITDA |
|---|---|---|---|
| 2026 | $968,544 | $1,015,880 | -$47,336 |
| 2027 | $1,172,448 | $1,176,321 | -$3,873 |
| 2028 | $1,376,352 | $1,336,873 | $39,479 |
| 2029 | $1,529,280 | $1,460,071 | $69,209 |
| 2030 | $1,631,232 | $1,545,918 | $85,314 |
Illustrative projections only; rounded to whole dollars. Operating expenses include COGS, variable costs, fixed expenses, and payroll.
Revenue rises from $968,544 in 2026 to $1,631,232 in 2030, reflecting purchases per day increasing from 95 to 160 with constant modeled basket composition and prices. The case shows negative EBITDA for 2026 and 2027, then positive EBITDA from 2028.
By 2030, the projected $85,314 EBITDA is an operating measure after merchandise, variable, fixed, and payroll costs. It is not net profit or available cash: depreciation, financing, taxes, capital expenditures, and working-capital movements are different calculations.
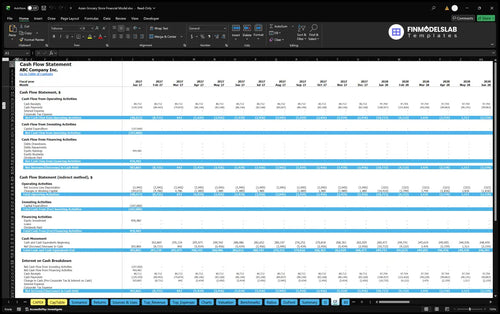
The Cash Flow Forecast presents operating, investing, and financing cash movements, including opening and closing cash reconciliations. Use it to assess how inventory purchases, supplier payment timing, capital spending, and owner funding affect liquidity beyond EBITDA.
The supporting reports help test operating viability, investment recovery, and sensitivity without assuming that the illustrated EBITDA determines returns.
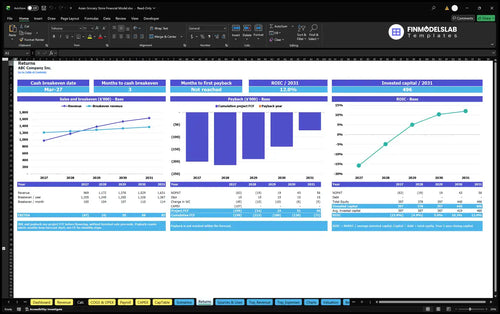
The Returns report distinguishes revenue needed for sales break-even from cash break-even timing, investment payback, and annual return on invested capital. These are different questions: covering operating costs is not the same as recovering opening investment or generating cash for owners.
The Break-Even, Payback and ROIC report compares revenue with break-even requirements and tracks cash-based investment recovery and annual capital returns. It provides decision metrics to review after entering the full investment, cash flow, and funding assumptions.
Dashboard scenario controls allow Low, Base, and High multipliers for revenue, direct costs, variable expenses, fixed overhead, and payroll. Compare outcomes when traffic grows more slowly, merchandise margins compress, or staffing costs change; no specific alternative-case results are asserted here.
The Financial Scenario Analysis compares Low, Base, and High projections for sales, gross margin, contribution margin, and EBITDA. It helps show whether changes in traffic, stock costs, or operating spending materially alter a proposed store plan.

These answers clarify what is editable, how the forecasts work, and which results require additional assumptions.
Yes. Edit purchases per day, trading days, retail units per basket, category unit shares, and selling prices; monthly and annual revenues recalculate from these drivers.
No. One checkout-demand pool is allocated across six merchandise categories, with unit shares totaling 100% before category prices are applied.
No. The provided case excludes delivery, a kitchen, a fresh meat counter, and alcohol sales. Those operations are not part of the stated revenue engine.
Yes. COGS, variable charges, fixed overhead, and role-based staffing are editable; Low, Base, and High scenario multipliers also support comparisons.
No. The 2026–2030 figures are illustrative financial projections. The published example stops at EBITDA and does not establish net profit.
No. Owner funding is an opening capital source, while EBITDA measures operating performance. The Cash Flow and Sources and Uses reports address different cash movements.
No. Debt service, capital spending, inventory working capital, taxes, and cash generation must be evaluated separately. The case provides no verified payback date or financing approval.
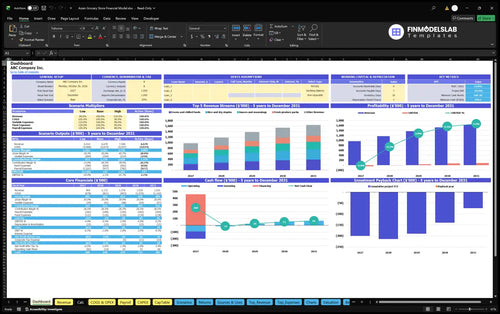
KPIs, forecasts, and cash flow at a glance.
Key assumptions and calculations driving revenue forecasts.
Funding sources, spending, and closing cash.
Cash break-even, payback, and ROIC.
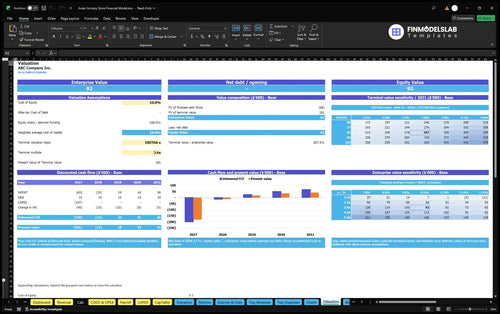
DCF valuation and sensitivity analysis.

Largest costs and spending trends.
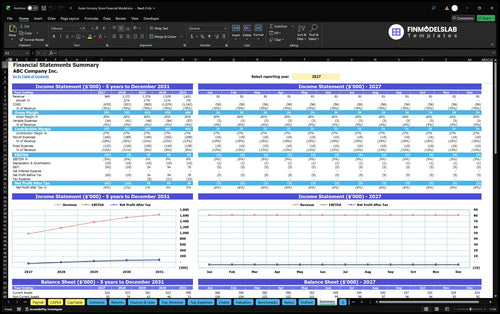
Annual and monthly financial performance.
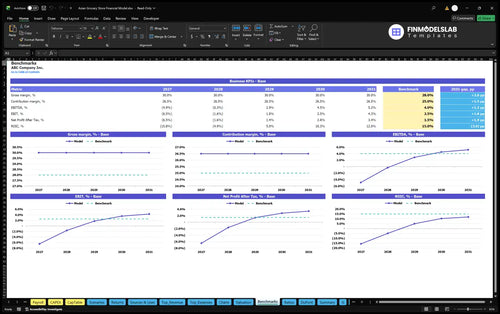
Compare margins and returns to benchmarks.

This template made it easy to see margins and break-even without digging through formulas. I saved hours on profit checks and could explain the numbers clearly in my lender call.

Running low, base, and high cases used to take me forever, but this model made it straightforward. I had all three versions ready in one afternoon, and it was much easier to compare outcomes.
I wasn’t sure what investors would expect, but the layout gave me a clear path. It helped me prepare a cleaner meeting deck and book a follow-up call with a potential backer.