

Revenue and Calc
Set capacity, occupancy, package mix, fees, and launch timing. Monthly calculations allocate resident-months and consolidate revenue.


The Assisted Living Facility Financial Model is an Excel template for forecasting resident revenue, expenses, staffing, investment, and financial statements. Occupied places and five all-inclusive care packages drive revenue without billing residents repeatedly for services.
The illustrative case models a leased 40-place, single-occupancy residence in suburban Ohio from 2026 through 2030, with a January 31, 2026 launch. It covers private-pay housing, meals, and assessed personal care, excluding a dedicated memory-care unit, skilled-nursing rehabilitation, and resident-paid prescription drugs.
The workbook connects facility-specific operating assumptions to monthly calculations, reports, funding schedules, and management analysis.
Set capacity, occupancy, package mix, fees, and launch timing. Monthly calculations allocate resident-months and consolidate revenue.
Budget care-related costs, rent, and overhead. Plan FTE, base compensation, and monthly payroll.
Schedule asset purchases, owner equity, and optional financing, keeping investment separate from debt service.
Review the projected income statement, cash flow statement, and balance sheet, plus consolidated Summary and Dashboard outputs.
Compare three scenarios, break-even, payback, and ROIC; Checks flag potential model issues.
The revenue forecast multiplies available places by occupancy, allocates occupied resident-months once among five packages, and applies each package fee.
The model begins with 40 available resident places and an occupied share increasing from 65% in 2026 to 92% in 2030. There is no assumed seasonality, and each month before the selected launch is zero; the selected launch month receives a full normal month.
Of occupied resident-months, 25% use Basic Support, 25% Medication Support, 20% Personal Care, 20% Enhanced Personal Care, and the remaining 10% High Assistance. Each resident receives one complete monthly package, preventing the same occupancy from being billed across multiple care streams.
The Revenue Forecast organizes capacity, annual occupancy assumptions, package allocations, and monthly fees. Its calculated resident-months and package sales feed the monthly Calc schedule and projected revenue totals.
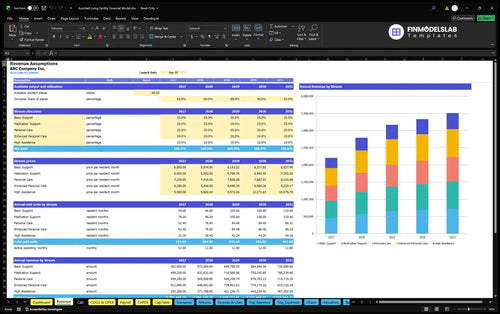
40 places × 65% occupancy × $7,070 weighted monthly package fee × 12 months = $2,205,840.
The weighted 2026 fee combines package prices of $5,800, $6,400, $7,200, $8,200, and $9,400 per month. Revenue changes with occupancy, care mix, and annual price increases.
Test occupancy and care mix against costs; package tariffs are estimates, not verified market rates.
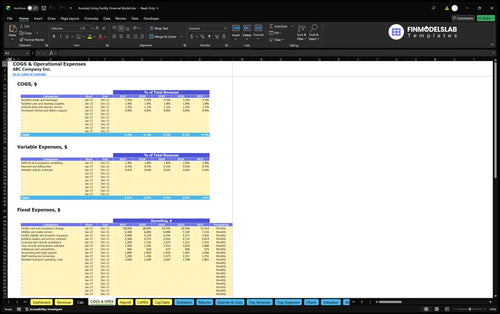
The forecast separates revenue-linked direct and variable costs, fixed facility overhead, and role-based payroll to calculate operating EBITDA.
Direct-cost assumptions include meals and beverages at 5.5% of revenue, resident care and cleaning supplies at 1.8%, laundry services at 1.2%, and purchased clinical and dietary support at 0.8%. Variable expenses include occupancy marketing at 1.8%, payment fees at 0.5%, and activity materials at 0.6%.
Fixed costs cover rent, utilities, insurance, licensing, repairs, and overhead. Monthly rent increases from $28,000 in 2026 to approximately $31,514 in 2030.
The COGS and Operating Expenses forecast separates percentage-of-revenue cost assumptions from fixed monthly charges. This allows occupancy and package-fee changes to flow through direct costs, variable spending, and EBITDA without treating fixed rent as a revenue percentage.
| Expense category | 2026 | 2030 |
|---|---|---|
| COGS | $205,143 | $326,799 |
| Variable expenses | $63,969 | $101,905 |
| Fixed expenses | $586,800 | $660,449 |
| Payroll | $1,506,500 | $1,707,000 |
Amounts are model estimates, rounded to whole dollars; categories are not duplicated.
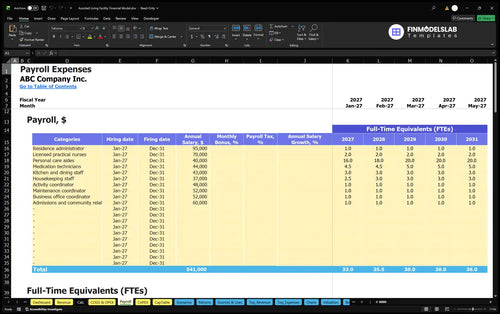
Payroll includes care, nursing, dining, housekeeping, and administration. Care aides increase from 16 to 20 annual-average FTE; medication technicians rise from 4.5 to 5 FTE.
Role salaries are annual amounts per FTE. Direct labor already included in COGS is not counted twice; employer taxes and benefits are excluded.
The Payroll Forecast tracks staffing FTE by role, salary assumptions, and monthly personnel spending. A manager can adjust care-aide coverage or medication technician levels and observe how annual payroll and operating profitability change.
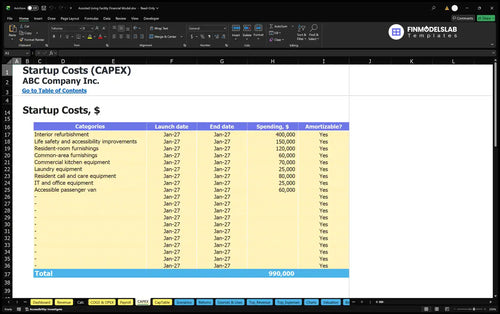
The capital and funding schedules distinguish preopening investment, opening liquidity requirements, working capital, and owner contributions.
Opening assets include $400,000 for interior refurbishment, $150,000 for life-safety and accessibility improvements, $120,000 for resident-room furnishings, and $60,000 for common-area furnishings. The case also includes kitchen, laundry, resident-call, technology, and vehicle investment items.
Other startup cash covers deposits, licensing, professional services, recruiting, preopening payroll, and rent, separate from annual EBITDA.
The Capital Expenditure Plan organizes refurbishment, equipment, furnishings, and other asset spending by amount and date. It also tracks depreciation and asset balances for related financial statements; depreciation is distinct from the operating EBITDA illustration.
Estimated initial owner funding of $1,819,675 includes assets, prelaunch cash, opening working capital, and a three-month operating reserve. It does not establish peak cash sufficiency.
Working-capital inputs are three receivable days, 24 payable days, and 11 inventory days. Their timing affects cash needs independently of EBITDA.
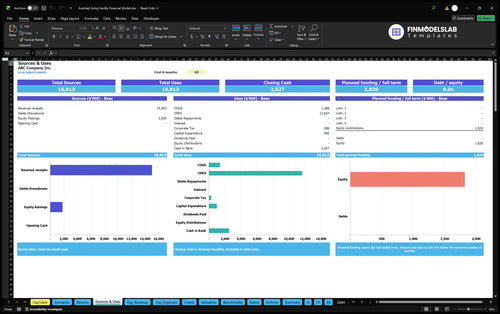
The Sources and Uses of Funds report reconciles planned funding and cash allocation across operations, investment, debt, and equity. It helps distinguish the initial owner contribution from resident revenue and shows how cash is committed or retained.
This selected model case shows a 2026 operating loss at EBITDA level followed by positive projected EBITDA as occupancy and resident revenue increase.
| Year | Revenue | Operating Expenses | EBITDA |
|---|---|---|---|
| 2026 | $2,205,840 | $2,362,412 | -$156,572 |
| 2027 | $2,796,326 | $2,550,556 | $245,771 |
| 2028 | $3,168,238 | $2,716,061 | $452,177 |
| 2029 | $3,337,450 | $2,755,381 | $582,069 |
| 2030 | $3,513,964 | $2,796,152 | $717,812 |
Model scenario, not historical results or industry averages. Displayed whole-dollar rounding can create $1 differences.
Revenue rises from $2,205,840 in 2026 to $3,513,964 in 2030, reflecting higher occupancy and yearly package-fee increases. In the same case, operating expenses rise more slowly than revenue, and EBITDA moves from negative $156,572 to positive $717,812.
The supplied operating forecast ends at EBITDA, not net profit or cash. Other reports calculate their own measures from additional assumptions.
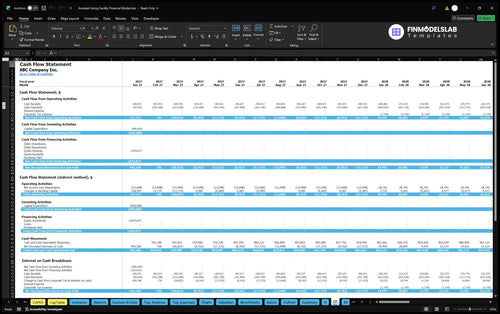
The Cash Flow Forecast distinguishes operating receipts and payments from capital expenditures, debt transactions, and owner funding. It is the relevant report for testing liquidity and closing cash balances rather than assuming positive EBITDA means available cash.
The supporting analysis helps test whether operating performance and funding assumptions make a proposed facility plan commercially workable.
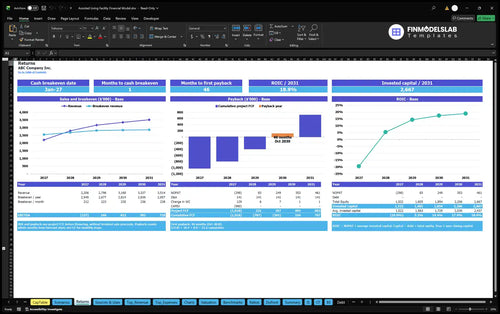
Sales break-even concerns operating coverage; cash break-even and investment payback concern cash recovery. Annual ROIC measures return on invested capital. None equals EBITDA.
No verified payback date or ROIC amount is supplied; review those metrics in Returns.
The Returns report separates sales break-even, cumulative free cash flow, investment payback, and annual ROIC. These metrics help assess how the proposed refurbishment, cash funding, and operating ramp relate to investment recovery.
Dashboard Low, Base, and High controls adjust revenue, COGS, variable costs, fixed costs, and payroll for scenario comparison.
Other worksheets offer valuation, ratios, benchmarks, and charts. Buyer-supplied benchmarks and local estimates require independent verification.
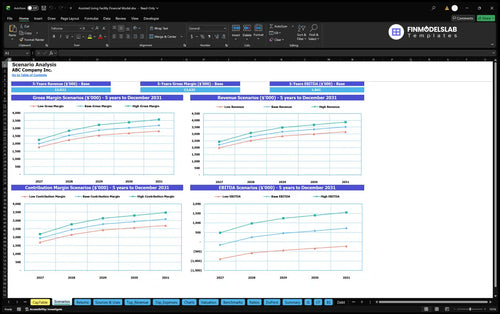
The Financial Scenario Analysis compares Low, Base, and High revenue, gross margin, contribution margin, and EBITDA. A facility planner can evaluate how revenue pressure, staffing costs, or higher overhead changes modeled operating margins.
Answers to common questions about the model’s assumptions, calculations, and report uses.
Yes. Edit available places and annual occupancy in Revenue to update resident-months and sales.
No. Each occupied resident-month is assigned to one of five complete care packages, with allocations totaling 100%.
No. The documented case excludes a dedicated memory-care unit, skilled-nursing rehabilitation, and resident-paid prescription drugs.
Yes. Payroll controls staffing and pay; COGS & OPEX controls care costs and overhead.
No. The annual figures are illustrative model estimates, not observed facility results or independently validated Ohio market averages.
No. EBITDA omits investment, financing, and working-capital cash movements. Review the Cash Flow, Balance Sheet, and Sources & Uses reports.
Yes. Returns calculates break-even, payback, and ROIC, but no case-specific payback date or ROIC is established.
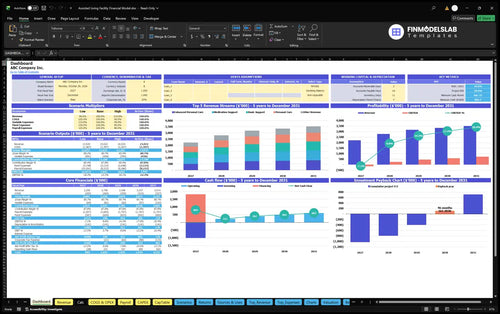
KPIs, forecasts, and cash flow at a glance.
Key assumptions and calculations driving revenue forecasts.
Funding sources, spending, and closing cash.
Cash break-even, payback, and ROIC.
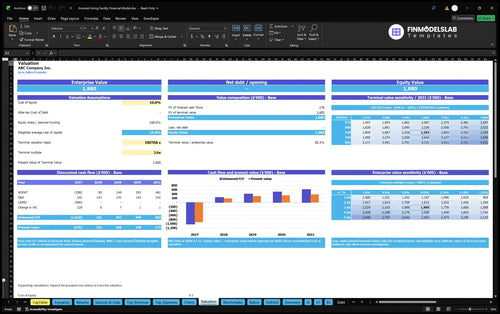
DCF valuation and sensitivity analysis.
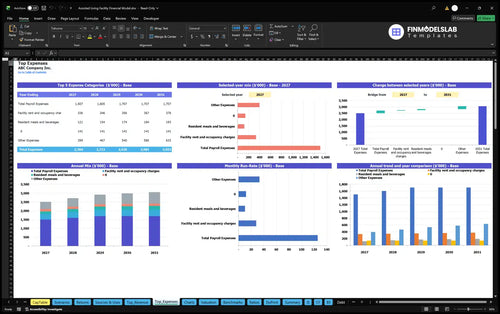
Largest costs and spending trends.
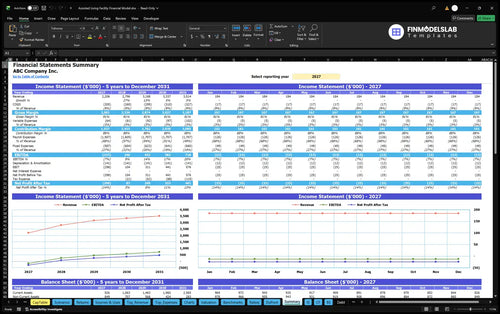
Annual and monthly financial performance.
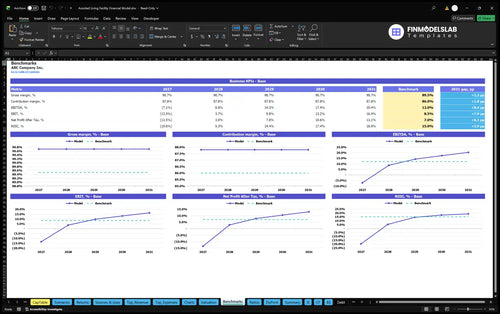
Compare margins and returns to benchmarks.

This template showed our assisted living margins and break-even in one place, so we stopped guessing and spent less time in spreadsheets. It cut our planning review by about 6 hours.
I no longer had to chase statements and charts across different files. Everything was in one clean workbook, which saved me a full afternoon before our lender meeting.
I felt better using a model built with checks in place, because one bad cell used to throw off the whole forecast. It helped me catch issues early and avoid a messy rebuild.