

Revenue & Calc
Set daily store traffic, operating days, checkout conversion, five basket shares, and prices. Calc allocates one transaction pool across the categories and produces monthly and annual sales.


The Auto Parts Store Financial Model is an Excel template for planning sales, costs, staffing, startup investment, and financial statements for one independent parts retailer. It builds monthly calculations and a 2026–2030 forecast from editable assumptions.
The illustrated case is a leased, 3,000-square-foot suburban Indianapolis location selling parts over the counter to DIY motorists and other local customers. It assumes payment at checkout, no installation workshop, no delivery fleet, no online sales, and no customer credit.
The workbook links store-level assumptions to monthly calculations, financing schedules, and management reports without requiring separate sales estimates for the same checkout.
Set daily store traffic, operating days, checkout conversion, five basket shares, and prices. Calc allocates one transaction pool across the categories and produces monthly and annual sales.
Enter merchandise-related cost rates, sales-linked expenses, monthly fixed charges, role-level staffing, salaries, and timing. These schedules feed operating expenses and the Income Statement.
Plan equipment and improvements, owner equity contributions, and optional financing facilities. Debt schedules support modeled principal and interest when financing assumptions are actually entered.
Review the selected case, revenue mix, margins, EBITDA, and Low, Base, and High scenario comparisons. The Dashboard also houses model settings and debt controls.
Revenue comes from store visits converted into one checkout pool, allocated across five mutually exclusive primary-category baskets at their net selling prices.
For 2026, 65 visits per day × 26 open days monthly × 65% checkout conversion drive sales. The selected January 2026 launch month is fully active.
Each checkout has one primary basket: maintenance 35% at $40, brakes 20% at $100, batteries 12% at $200, electrical 18% at $90, and accessories 15% at $35. Associated items are included, not counted as new transactions.
The Revenue Forecast organizes daily visits, conversion, basket allocation, and realized category prices into one linked sales plan. Change an input to see its effect on projected transaction volume, category mix, and total retail sales.

65 visits/day × 26 days/month × 65% conversion × $79.45 weighted basket × 12 months = $1,047,310 annual revenue (rounded).
Daily visits increase to 75, 85, 90, and 95 during 2027–2030. Prices, basket mix, open days, and conversion stay flat, so growth comes from traffic, not price inflation or a new channel.
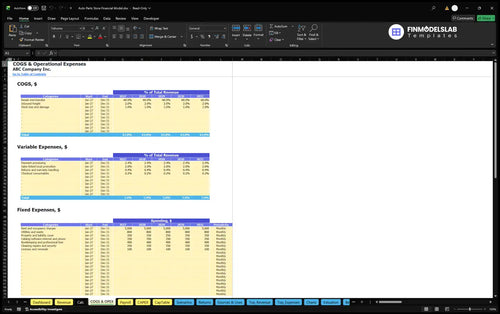
The model separates merchandise COGS, variable selling expenses, monthly fixed costs, and fixed-salary payroll so the same payment is not counted twice.
Resale merchandise is 60% of revenue, inbound freight 2%, and stock loss or damage 1%, totaling 63% direct costs. Sales-linked expenses total 5%: processing 2.4%, local promotion 2%, warranty and returns handling 0.4%, and checkout consumables 0.2%.
Annual fixed charges are $88,200 in the illustrative case, including rent and occupancy at $5,000 each month. Utilities, insurance, catalog software, professional fees, cleaning, security, and licenses are also covered as fixed expenses.
The COGS and Operating Expenses forecast links merchandise margins, sales-linked spending, and recurring overhead to projected revenue. Review these distinct categories to see how a change in product economics or occupancy costs changes contribution and EBITDA.
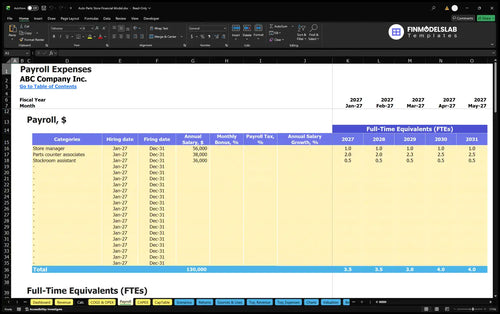
Payroll includes the paid owner-manager at $56,000, counter associates at $38,000 per FTE, and a half-time stockroom assistant whose full-time salary basis is $36,000.
The Payroll Forecast tracks staffing by role, annual-average FTE, compensation, and monthly personnel expense. Counter associate staffing grows from 2 FTE in 2026 to 2.5 in 2030, increasing total modeled payroll from $150,000 to $169,000.
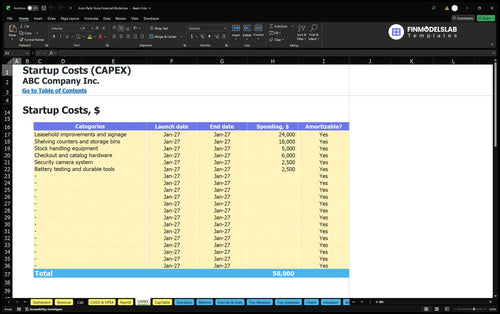
Opening capital is planned separately from recurring operating costs and from EBITDA, with distinct schedules for equipment, preopening cash, inventory, and financing.
Specified startup assets include $24,000 for leasehold improvements and signage, $18,000 for shelving and counters, $5,000 for stock handling, and $6,000 for checkout and catalog hardware. Security equipment, battery testing, and other durable tools are additional asset items.
Deposits, formation costs, opening marketing, and preopening occupancy or training are distinct cash uses, not duplicated in annual operating expenses.
The Capital Expenditure Plan schedules durable purchases and their depreciation treatment. It helps separate the store build-out and equipment investment from operating expenses, while supporting the financial statements with dated asset transactions.
Working-capital controls use 0 accounts-receivable days, 15 accounts-payable days, and 116 inventory days. Checkout payment eliminates modeled customer credit, while inventory purchases can require substantial opening cash ahead of sales.
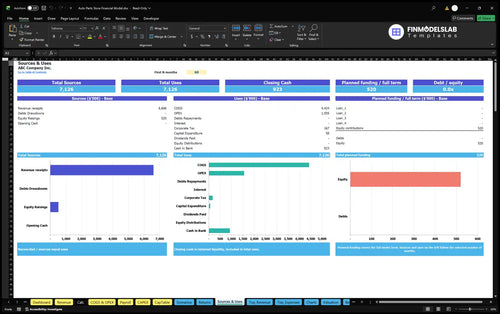
Estimated initial owner funding of $520,224 covers assets, prelaunch cash, opening working capital, and a three-month outflow reserve. No non-owner funding is committed.
The Sources and Uses of Funds report reconciles cash inflows and outflows, including owner equity, optional debt, operating payments, and investment. Use it with Cash Flow to inspect planned funding allocation instead of interpreting owner contributions as store revenue.
The illustrative case projects rising traffic and EBITDA across 2026–2030 under its selected nominal prices, cost rates, and staffing assumptions.
| Year | Revenue | Operating Expenses | EBITDA |
|---|---|---|---|
| 2026 | $1,047,310 | $950,371 | $96,939 |
| 2027 | $1,208,435 | $1,059,935 | $148,499 |
| 2028 | $1,369,559 | $1,179,000 | $190,559 |
| 2029 | $1,450,121 | $1,243,283 | $206,839 |
| 2030 | $1,530,684 | $1,298,065 | $232,619 |
Illustrative projections, not actual store results or industry averages. Whole-dollar rounding may produce small differences between visible totals.
The projected 2026 EBITDA of $96,939 rises to $232,619 in 2030; the corresponding EBITDA margins are approximately 9.3% and 15.2%. In this case, higher visits generate additional revenue while fixed overhead remains flat and counter staffing expands.
Total operating expenses include merchandise costs, sales-linked expenses, fixed overhead, and payroll. EBITDA is revenue less those expenses; it is not net profit, cash available to owners, or proof that the startup reserve is sufficient.
The Projected Income Statement provides monthly profit-and-loss reporting from sales through gross margin, contribution, EBITDA, and further accounting lines. The brief supplies numerical outcomes only through EBITDA; later statement lines must be checked in the buyer’s configured workbook.
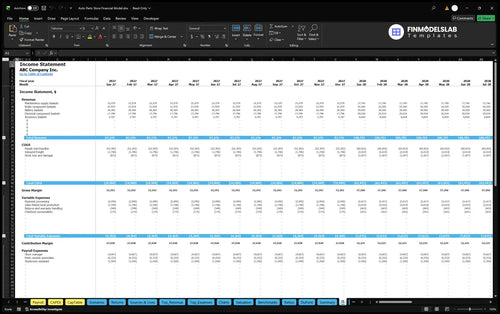
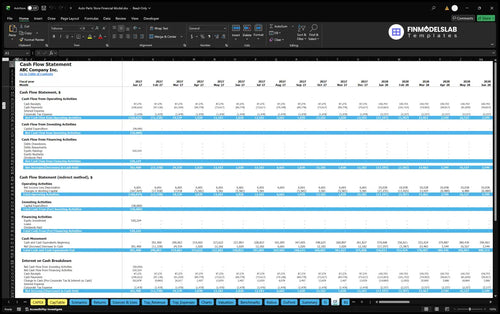
The Balance Sheet and Cash Flow reports address working capital, investment, debt, equity, and liquidity, which are distinct from operating EBITDA.
The Cash Flow Forecast tracks receipts, operating payments, investment, and financing movements to show opening-to-closing cash. Review liquidity and inventory funding separately from earnings because sales, purchasing, and equity contributions affect cash at different times.
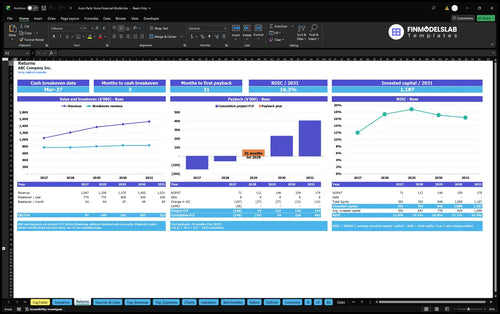
The Returns and scenario reports support evaluation of operating break-even, investment recovery, and sensitivity without assuming an unverified payback period or return percentage.
Sales break-even measures operating cost coverage; cash break-even concerns cash movements. Payback follows cumulative project cash flows, while annual ROIC compares returns against invested capital. None equals EBITDA.
Adjust visits, conversion, basket economics, expense assumptions, or financing entries to examine alternative outcomes. Low, Base, and High controls can apply multipliers to revenue, COGS, variable expenses, fixed costs, and payroll.
The Returns report brings together break-even, project cash recovery, investment payback, and annual ROIC analysis. Use its actual calculated cash-flow and invested-capital figures rather than converting the illustrative EBITDA projections into a made-up payback date.
Answers to common questions about editable inputs, sales logic, opening capital, and what the illustrated projections establish.
Yes. Edit store visits, open days, conversion, and the category basket shares or prices; the linked revenue calculations reflect the selected assumptions.
No. It allocates one converted checkout to one primary basket, with associated items included in the basket price.
No. The documented operating case covers counter retail sales only, without repairs, paid installation, deliveries, or an online channel.
It is estimated owner funding for startup assets, preopening cash, opening working capital, and a planned three-month operating outflow reserve, not operating income.
No. The provided case supports EBITDA through 2030, not an independently established net profit, final cash balance, or investment return.
Yes. Dashboard scenario controls support Low, Base, and High assumptions for revenue and several cost categories, with corresponding comparative reporting.
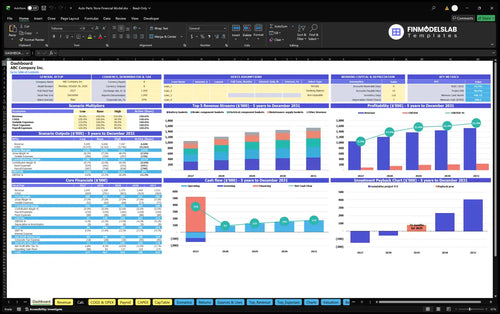
KPIs, forecasts, and cash flow at a glance.
Key assumptions and calculations driving revenue forecasts.
Funding sources, spending, and closing cash.
Cash break-even, payback, and ROIC.
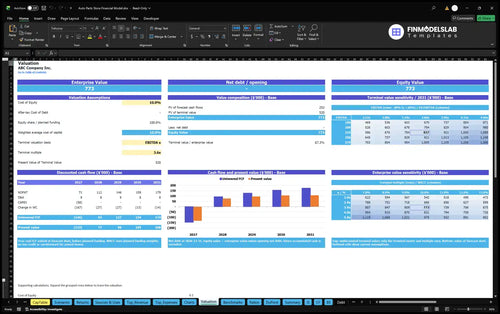
DCF valuation and sensitivity analysis.
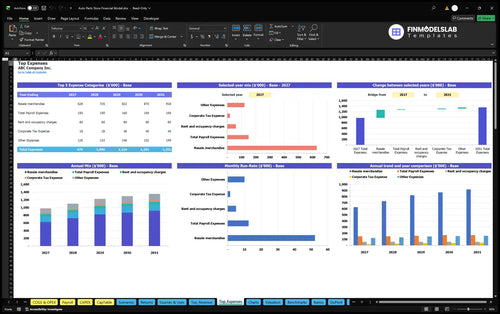
Largest costs and spending trends.
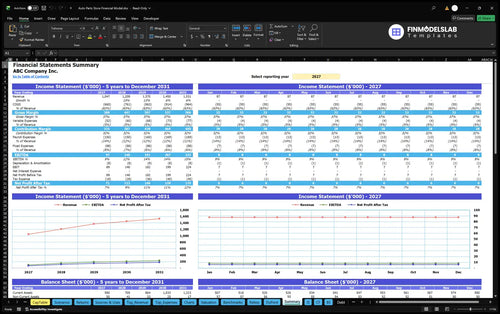
Annual and monthly financial performance.
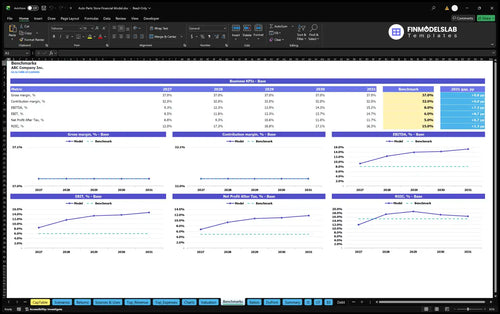
Compare margins and returns to benchmarks.

I didn’t know where to begin, and that was the hardest part. This template gave me a clear starting point, so I built a first draft in one afternoon instead of staring at an empty workbook.

I kept worrying one broken cell would throw off the whole model. The pre-built structure made it easier to trust the numbers and finish my review 2 hours faster.
Cash needs were always a moving target for me. With the cash flow tabs already laid out, I could see shortfalls earlier and plan my next meeting with the bank with much more confidence.