The Bar Financial Model is an Excel financial projections template for planning an independent, beverage-only neighborhood bar. It connects seating capacity, customer visits, drinks sold and selling prices with monthly operating costs, staffing, capital spending and financial reports for 2026 through 2030.
The illustrative case operates in a 2,400-square-foot leased US location with 70 indoor seats, service on six days per week and no kitchen, delivery or cover charges. Its results are editable planning assumptions, not historical bar performance or guaranteed outcomes.
Indoor seats
70shared capacity pool
Beverage categories
6one allocated sales mix
Forecast
5years, 2026 to 2030
Service days
26per forecast month
WHAT IS INCLUDED
An Integrated Bar Planning Workbook
The workbook connects editable operating assumptions to monthly calculations and financial statements, with supporting investment, financing and management reports.
Revenue and Calc
Plan a single pool of seat visit slots, beverage quantities, product mix and realized selling prices. Monthly calculations distribute the resulting sales across draft beer, packaged beer, wine, cocktails, spirits and non-alcoholic drinks.
COGS & OPEX and Payroll
Separate beverage stock and serving supplies from transaction-related costs, recurring overhead and fixed base salaries. Payroll schedules organize role-specific full-time-equivalent staffing and compensation.
CAPEX, CapTable and Debt
Schedule startup equipment and improvements, dated equity contributions and optional financing facilities. Debt controls support repayment types, borrowing terms and interest schedules without assuming a loan has been approved.
Statements and Dashboard
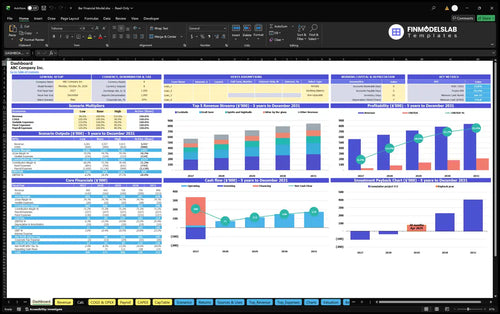
Review projected income statements, cash flows and balance sheets alongside selected-scenario management indicators. The Dashboard also holds model setup, working-capital assumptions and Low, Base and High controls.
Returns and Model Checks
Use break-even, investment payback and return-on-invested-capital reports as distinct analyses. Checks help identify missing assumptions, inconsistent schedules and financial-statement reconciliation issues.
REVENUE FORECAST
Bar Revenue Starts With Available Seat Visits
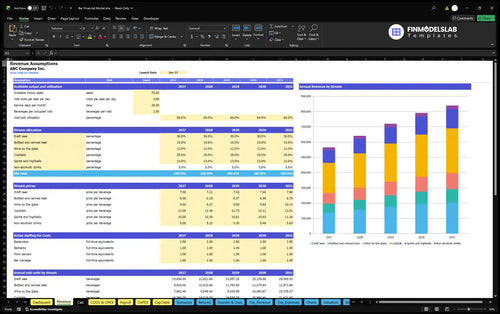
The bar revenue forecast begins with one shared visit-slot capacity calculation, then allocates beverages across six priced drink categories.
The operating inputs are 70 seats, three visit slots per seat daily, 26 service days per month and two beverages per occupied visit. Visit-slot utilization increases from 50% in 2026 to 66% in 2030 in the illustrative Base planning case.
The six-item beverage mix totals 100%: draft beer 30%, bottled and canned beer 15%, wine by the glass 12%, cocktails 25%, spirits and highballs 13%, and non-alcoholic drinks 5%. Each beverage is allocated only once.
Revenue Forecast
The Revenue Forecast shows the seating, visit frequency, utilization and beverage-mix inputs that drive sales. Changing a drink price or mix allocation changes projected revenue without creating a second independent guest-demand assumption.
2026 monthly beverage volume
70 seats × 3 visit slots × 26 days × 2 drinks × 50% utilization = 5,460 beverages per month.
At the entered 2026 prices, weighted realized revenue is $8.63 per beverage. That produces approximately $47,120 in monthly beverage sales, or $565,438 for the full 2026 model year; the model assumes sales begin in the January launch month.
COST AND PAYROLL PLANNING
Separate Stock, Overhead and Employee Pay
Operating expenses are modeled through direct beverage costs, revenue-linked variable charges, fixed overhead and a separate payroll schedule.
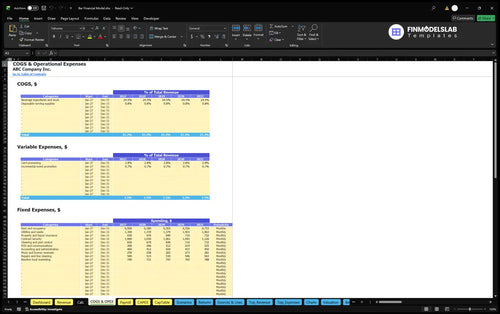
Direct costs include beverage ingredients and stock at 24.5% of revenue and disposable serving supplies at 0.8%. Variable expenses add card processing at 2.8% and incremental event promotion at 0.7%; these percentages apply to total business revenue.
COGS and Operating Expenses
The COGS and Operating Expenses report separates direct costs, variable charges and fixed overhead, so each payment component enters the operating forecast once. Fixed categories cover rent, utilities, insurance, security, cleaning, administration, music licensing, repairs and baseline marketing.
Monthly rent and occupancy begins at $6,000 in 2026 and increases to $6,753 by 2030. With 12 paid months, total modeled fixed expenses rise from $139,800 in 2026 to $157,346 in 2030.
Payroll Forecast by Staff Role
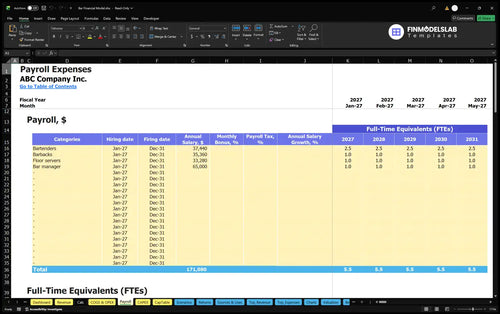
The Payroll Forecast organizes 2.5 bartender FTEs plus one barback, one floor server and one bar manager. Annual base compensation totals $227,240 under the selected assumptions; those salaries are not charged again to COGS or other operating expenses.
STARTUP INVESTMENT AND FUNDING
Startup Assets Are Not Annual Bar Earnings
The model separates opening equipment, preopening cash needs and funding from the income earned after the bar begins trading.
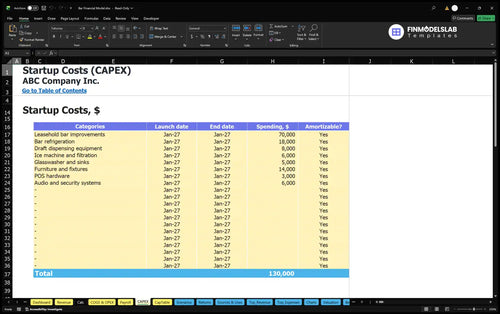
Selected startup assets include $70,000 of leasehold bar improvements, $18,000 of refrigeration, $8,000 of draft equipment and $6,000 for an ice machine and filtration. Additional planned assets include sinks, a glasswasher, furnishings, point-of-sale hardware, audio and security systems.
Capital Expenditure Plan
The Capital Expenditure Plan organizes dated purchases and depreciable assets. It helps distinguish setup investment from the bar’s ongoing operating expense categories and links capital spending to the workbook’s depreciation schedules.
The opening cash plan also includes a lease deposit, permits, preopening rent and training, launch marketing, legal setup and smallwares. Receivables and payables are each set to zero days because tabs settle during visits and tangible purchases are paid on delivery; inventory is modeled at 21 days.
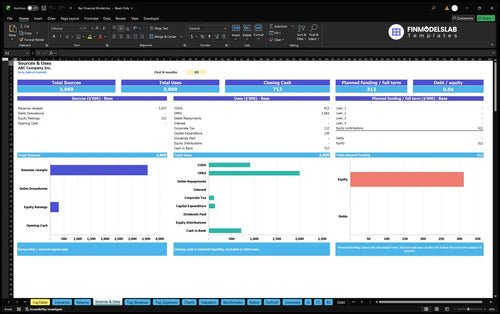
Sources and Uses of Funds
The Sources and Uses of Funds report organizes financing inflows against operating, investing and other cash uses. The case includes estimated initial owner funding of $312,202, based on qualifying startup costs, opening working capital and a three-month operating reserve, less confirmed outside funding.
ILLUSTRATIVE FIVE-YEAR OUTPUT
Projected Bar Revenue, Expenses and EBITDA
The example operating forecast runs from 2026 through 2030, with higher utilization and updated beverage prices affecting annual revenue and EBITDA.
Illustrative Base operating forecast, US dollars
Year
Revenue
Operating Expenses
EBITDA
2026
$565,438
$529,886
$35,552
2027
$640,641
$555,739
$84,902
2028
$719,984
$582,909
$137,075
2029
$790,853
$607,769
$183,084
2030
$840,207
$626,566
$213,641
Illustrative model outputs rounded to whole dollars; displayed columns can differ slightly because of rounding.
In this scenario, 2026 revenue of $565,438 exceeds operating expenses of $529,886, leaving EBITDA of $35,552. By 2030, projected EBITDA reaches $213,641 as higher beverage volume and prices absorb a larger share of the fixed cost base.
EBITDA is a measure of operating performance before depreciation, interest and tax. It is not net profit, free cash flow or an amount available for owner distribution.
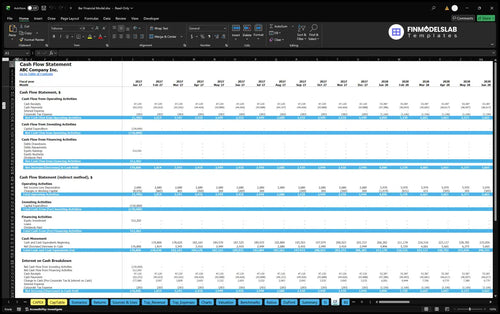
Cash Flow Forecast
The Cash Flow Forecast separately follows operating receipts and payments, startup investment, debt activity and equity contributions through monthly cash balances. Use it to assess funding timing and potential liquidity gaps rather than treating positive EBITDA as sufficient cash.
BREAK-EVEN AND SENSITIVITY
Test Coverage, Payback and Different Demand Cases
Returns and scenario tools help assess the bar’s ability to cover costs and recover investment, without confusing those measures with projected EBITDA.
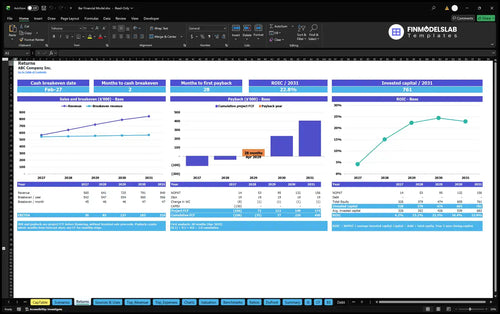
Sales break-even compares revenue with the operating cost structure. Cash break-even considers the timing of actual cash flows, investment payback tracks recovery of the initial investment and annual ROIC relates returns to invested capital; these measures answer different questions.
Break-Even, Payback and ROIC
The Returns report provides break-even, investment payback and ROIC analyses using the workbook’s schedules. No particular payback month or ROIC value is claimed for this bar case because the supplied operating illustration ends at EBITDA.
Use Dashboard scenario controls to compare Low, Base and High revenue and cost multipliers, or edit the seating utilization and drink prices directly. Compare the resulting margins, cash-flow requirements and return measures before committing to a lease, staffing plan or investment.
FREQUENTLY ASKED QUESTIONS
Questions About the Bar Financial Model
These answers clarify what the workbook calculates and where its illustrative assumptions need replacement.
Can I change the number of seats and visits?
Yes. Adjust seats, daily visit slots, service days, drinks per occupied visit and utilization to recalculate the single beverage-volume pool.
How are beer, wine and cocktail sales projected?
The calculated beverage quantity is allocated once across six drink categories, then multiplied by each category’s realized selling price.
Does this bar model include food revenue?
No. The supplied operating case covers on-premises beverages only, without a kitchen, delivery, cover charge or independent food sales.
Where do I edit salaries and staffing?
Use Payroll to change staffing roles, full-time-equivalent plans and compensation; the selected case includes 5.5 FTEs and $227,240 of annual base payroll.
Does the workbook show cash flow and a balance sheet?
Yes. The declared financial reports include monthly cash flow and balance sheet projections; the case figures shown here are limited to revenue, operating expenses and EBITDA.
Can I compare scenarios and financing choices?
Yes. Dashboard scenario multipliers support Low, Base and High cases, while debt controls and schedules support alternative financing inputs.
Is the $312,202 owner funding amount a required investment?
No. It is an estimated opening funding assumption for the illustrative scenario, not a confirmed capital requirement for every bar.
What Does the Bar Financial Model Contain?
Financial Dashboard
KPIs, forecasts, and cash flow at a glance.
Revenue Engine
Key assumptions and calculations driving revenue forecasts.
Sources & Uses
Funding sources, spending, and closing cash.
Returns & Break-Even
Cash break-even, payback, and ROIC.
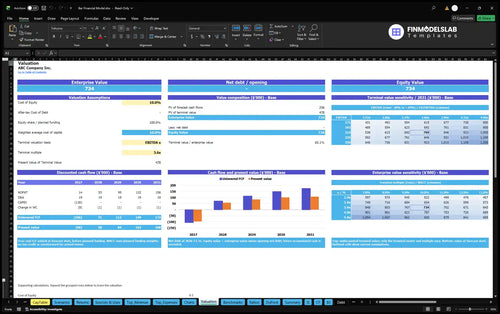
Business Valuation
DCF valuation and sensitivity analysis.
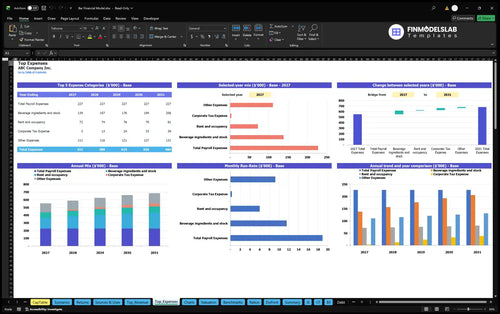
Expense Breakdown
Largest costs and spending trends.
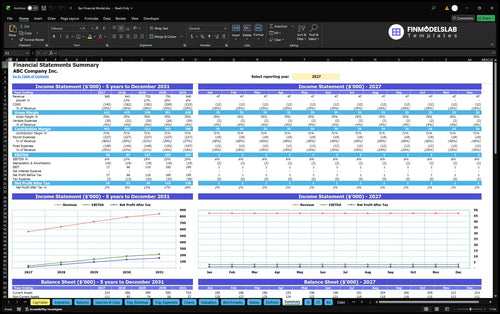
Financial Summary
Annual and monthly financial performance.
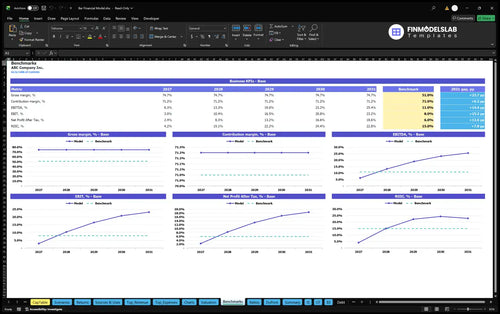
KPI Benchmarks
Compare margins and returns to benchmarks.
Trusted by 25,000+ startup founders, investors and CPAs
Blank Sheet, Less Stress
Megan Collins, NY
I wasn’t sure where to start, and this template gave me a clear path right away. I saved about 8 hours and had a draft I could actually build on instead of staring at an empty spreadsheet.
Clear Outputs For Investors
Daniel Harper, CA
I could see what investors wanted much faster, which saved me from guessing at the structure. The model made it easier to present clean numbers and get a follow-up meeting booked.
Easier Scenario Planning
Lauren Mitchell, TX
Setting up low, base, and high cases used to take forever. This template made the comparisons simple, and I cut my scenario work down by nearly half a day.
Choosing a selection results in a full page refresh.