

Revenue and Calc
Set daily meal capacity, service days, utilization, menu prices, and exclusive meal shares. Calc forecasts monthly meal volumes and sales.


The BBQ Restaurant Financial Model is an Excel financial planning template for estimating meal sales, operating expenses, staffing, startup investment, and financial performance. It converts shared kitchen capacity, utilization, and a five-item menu mix into monthly calculations and a 2026–2030 forecast.
The illustrative case is a counter-service restaurant at a hypothetical leased 2,500-square-foot site in suburban Indianapolis, serving dine-in and pickup meals six days weekly. Catering, delivery platforms, and alcohol are excluded.
Editable operating assumptions feed monthly schedules and the workbook’s financial and management reports.
Set daily meal capacity, service days, utilization, menu prices, and exclusive meal shares. Calc forecasts monthly meal volumes and sales.
Plan ingredient and supply costs, transaction-linked expenses, occupancy and other fixed charges, plus annual FTE and salaries for the manager, pit, counter, sides, and cleaning teams.
Schedule equipment and leasehold investment, record owner equity, and configure financing if needed. The case presumes no borrowing facility.
Review headline financial metrics, choose Low, Base, or High scenario multipliers, and inspect model reconciliation checks. Scenario controls and financing inputs live on the Dashboard.
Review Income Statement, Cash Flow, Balance Sheet, Summary, Returns, Sources & Uses, Benchmarks, Valuation, Ratios, and Charts reports.
Revenue comes from a single daily meal-output pool, rather than separate forecasts for seats or independent menu demand.
Enter available complete meals per day, monthly service days, and annual utilization. The model multiplies these inputs to estimate meals sold, allocates each meal to exactly one category, and applies its net selling price.
The five complete meal categories are pulled pork ($15, 30%), brisket ($22, 25%), ribs ($25, 20%), chicken ($17, 15%), and sausage ($16, 10%). Each includes two sides and a fountain drink, so included components are not billed again.
The Revenue Forecast connects daily kitchen capacity, service frequency, utilization, meal allocation, and menu prices to category sales. Changing utilization or the menu mix updates the monthly revenue calculations and annual sales projection.
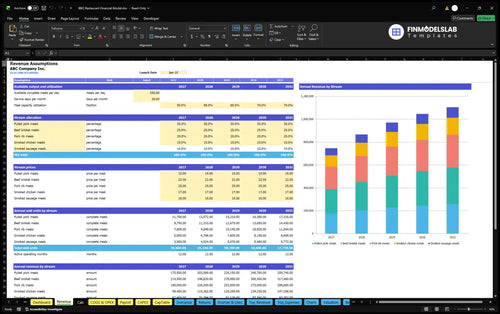
250 meals per day × 26 days × 50% utilization = 3,250 meals per month; 3,250 × $19.15 weighted meal price × 12 months = $746,850 annual revenue.
The weighted ticket uses the five-category mix. Utilization rises from 50% in 2026 to 74% in 2030 with unchanged prices and category shares.
The launch setting is January 31, 2026, with the entire selected launch month active in the source calculation. The model uses 60 forecast months, rather than prorating January to a single operating day.
The model separates revenue-linked direct costs, variable expenses, monthly fixed charges, and salaried personnel expenses to avoid double counting.
Cost of goods sold totals 35% of revenue: 32% for meat, sides, and beverage ingredients, 1% for smoking fuel, and 2% for packaging and sanitation. Variable operating expenses add 2.8% for payment processing and 1% for sales-linked promotions.
Fixed expenses total $108,000 annually in the illustration. They include occupancy, utilities, insurance, equipment service, waste and pest control, POS and communications, professional services, baseline marketing, and recurring permits or music renewals.
The COGS and Operating Expenses forecast separates direct ingredient and smoking costs, sales-linked fees, and fixed restaurant overhead. Adjusting these inputs shows how higher meal revenue changes costs and the resulting operating margins.
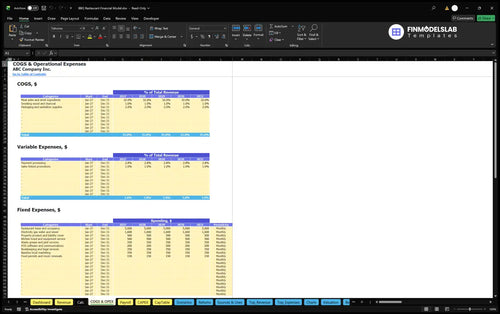
The illustrative lease and occupancy line is $5,000 per month for 12 paid months. Direct costs and payment-linked charges grow with revenue, while the selected fixed annual coverage stays at $108,000 throughout the five-year operating case.
Payroll is separate from direct, variable, and fixed costs, avoiding duplicated staff expense.
The Payroll Forecast plans annual-average full-time-equivalent staffing and fixed base salary by restaurant role. It links the owner-manager, pit cooks, counter staff, side preparation, and cleaning staff to monthly personnel expense schedules.
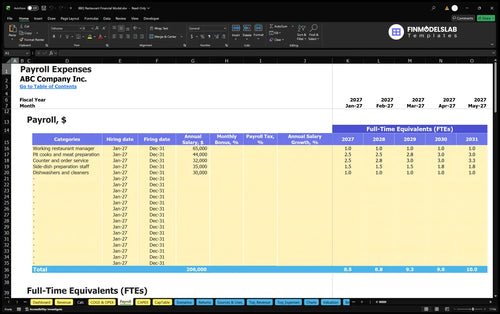
The working restaurant manager earns a modeled $65,000 annual base. Pit preparation increases from 2.5 to 3.0 FTE and counter service from 2.5 to 3.25 FTE between 2026 and 2030; total base payroll rises from $337,500 to $392,250.
Employer taxes and benefits are excluded; wage inputs are estimates, not verified local rates.
Opening equipment, prelaunch payments, and working capital are separate from ongoing restaurant operating expenses.
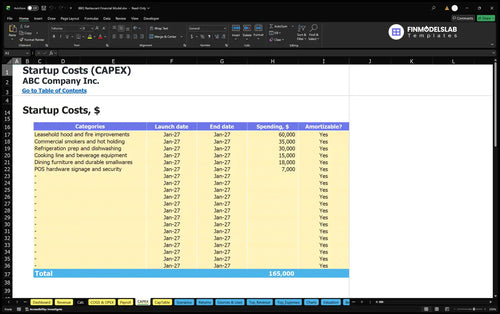
Selected startup assets include $60,000 for leasehold hood and fire improvements, $35,000 for smokers and hot holding, $30,000 for refrigeration, prep, and dishwashing, and $15,000 for cooking-line and beverage equipment.
Other startup assets cover durable furniture, smallwares, signage, POS hardware, and security. Separate preopening cash items include deposits, inspections, legal setup, opening marketing, training, occupancy, insurance, and employee base pay before operations.
The Capital Expenditure Plan schedules restaurant asset purchases and distinguishes depreciable equipment from non-depreciable spending. The CAPEX report supports investment timing and asset depreciation calculations; these are not the same as recurring operating expenses.
Estimated owner funding is $394,468, intended to cover assets, distinct preopening expenses, opening working capital, and three months of first-year recurring outflows.
Working capital controls use zero accounts-receivable days, seven accounts-payable days, and ten inventory days. These assumptions affect cash timing, but the stated EBITDA operating forecast alone does not prove that opening funding will be sufficient.
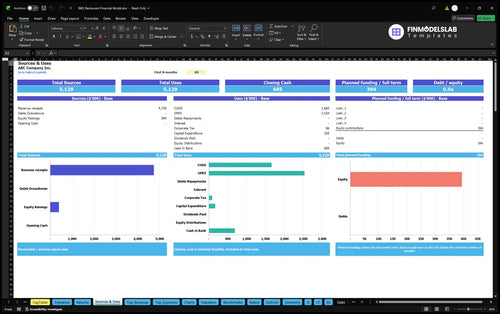
The Sources and Uses of Funds report summarizes funding inflows and cash allocations over the chosen reporting period. It helps compare owner equity, any entered debt, operational cash flows, investment spending, and cash retained in the business.
The hypothetical base case shows EBITDA growing as shared meal capacity is used more intensively across the 2026–2030 forecast.
| Year | Revenue | Operating Expenses | EBITDA |
|---|---|---|---|
| 2026 | $746,850 | $735,278 | $11,572 |
| 2027 | $866,346 | $789,642 | $76,704 |
| 2028 | $970,905 | $849,211 | $121,694 |
| 2029 | $1,045,590 | $897,939 | $147,651 |
| 2030 | $1,105,338 | $929,121 | $176,217 |
Figures are hypothetical scenario outputs rounded to whole dollars; displayed totals may differ slightly because of rounding.
In this selected case, annual revenue increases from $746,850 in 2026 to $1,105,338 in 2030 as utilization rises. Annual operating expenses increase from approximately $735,278 to $929,121, while modeled EBITDA moves from $11,572 to $176,217.
EBITDA is revenue after the documented COGS, variable charges, fixed expenses, and Payroll, before depreciation, financing interest, taxes, and other accounting effects. These figures are forecasts, not historical results, industry averages, or a net-profit calculation.
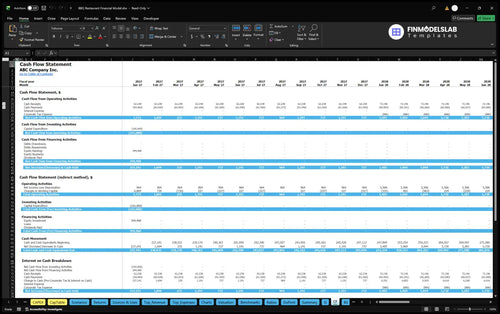
The Cash Flow Forecast presents modeled operating, investing, and financing cash movements with an opening-to-closing cash reconciliation. Use it to evaluate payment timing, investment spending, funding needs, and potential liquidity pressure beyond the EBITDA results.
The workbook includes tools to assess operating break-even, investment recovery, returns, and sensitivity without assuming these outcomes are guaranteed.
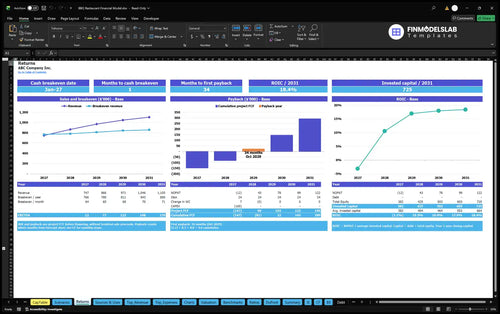
The Returns report distinguishes sales break-even from cash break-even, tracks project and cumulative cash flows for payback analysis, and calculates return on invested capital. These are separate metrics, and no payback period or annual ROIC result is established by the supplied BBQ operating summary.
The Returns analysis compares modeled revenue with break-even requirements and examines project cash flow, cumulative investment payback, and annual ROIC. It supports evaluation of different business choices without treating EBITDA as cash or investment return.
Dashboard scenario controls let you change revenue, COGS, variable operating expenses, fixed expenses, and payroll through Low, Base, and High multipliers. Comparing cases can expose how a lower service utilization or higher costs could change restaurant profitability.
Valuation, Benchmarks, Ratios, and Summary offer further analysis, but no verified local benchmarks, valuation results, or investor returns are supplied.
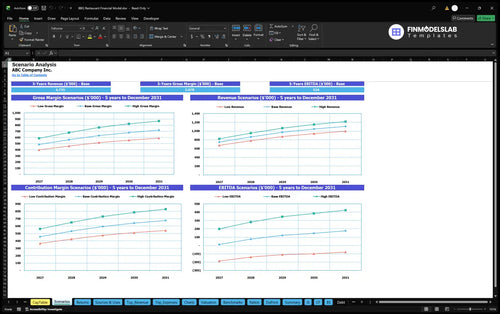
The Financial Scenario Analysis compares Low, Base, and High cases for revenue, gross margin, contribution margin, and EBITDA. It helps restaurant operators evaluate changes in sales performance and cost intensity before committing to a staffing or investment plan.
Answers about the assumptions, scope, and financial analysis included in this Excel template.
Yes. Edit the menu prices and mutually exclusive meal shares on Revenue; the calculations allocate the shared volume pool once across the five complete-meal categories.
It multiplies available meals per service day by monthly service days and capacity utilization, then assigns those meals to the menu categories.
No. Each menu price covers one complete meal, including two sides and a fountain drink, without a separate charge for those included items.
Yes. Payroll plans staffing FTE, pay, dates, and related personnel calculations by role, with annual staffing assumptions for the five-year forecast.
No. EBITDA measures the documented operating result, while liquidity depends on investment, funding, working capital, and cash-flow timing.
Yes. The workbook includes Income Statement, Cash Flow, Balance Sheet, management reports, and Low, Base, and High scenario controls.
No. The modeled revenue is limited to five dine-in or pickup complete-meal categories; catering, delivery-platform transactions, and alcohol are outside the selected case.
No. The 2026–2030 numbers illustrate selected assumptions for a hypothetical suburban Indianapolis restaurant and are not actual historical performance or verified local averages.
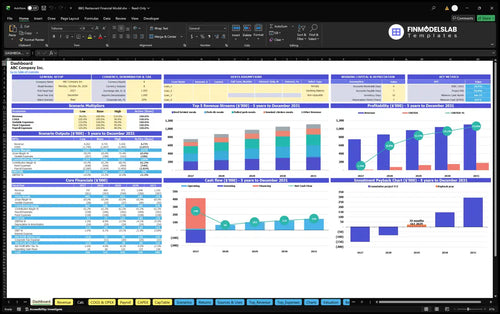
KPIs, forecasts, and cash flow at a glance.
Key assumptions and calculations driving revenue forecasts.
Funding sources, spending, and closing cash.
Cash break-even, payback, and ROIC.
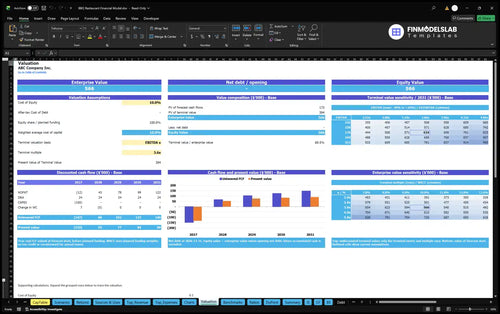
DCF valuation and sensitivity analysis.
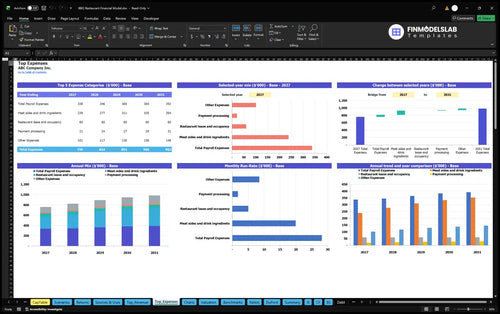
Largest costs and spending trends.
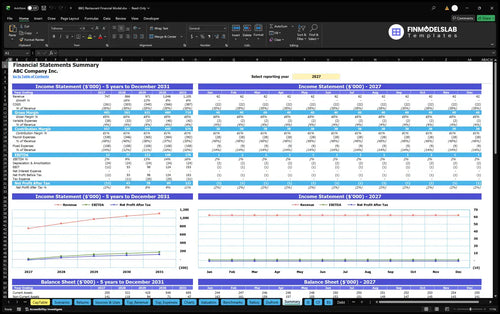
Annual and monthly financial performance.
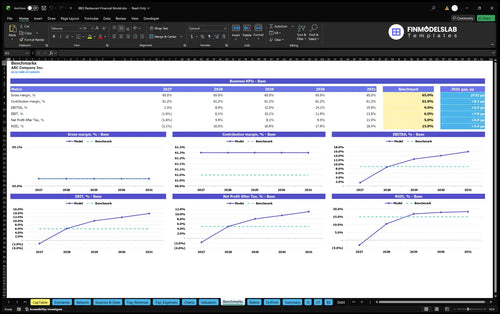
Compare margins and returns to benchmarks.

This gave me a clear structure for what investors wanted to see, so I stopped guessing at the format and could explain the numbers with confidence. It made my first draft much easier to review and share.

I spent far less time building the projections by hand because the model already had the key sheets and formulas in place. What used to take me most of a week was done in a few hours.
I was staring at a blank spreadsheet and didn’t know where to begin. This template gave me a clean starting point, and I had my BBQ restaurant plan moving the same day.