

Configure Products
Define each manufactured product line, launch timing, and whether the line is enabled.


The Biomass Power Plant Financial Model is an editable five-year workbook built around product units, unit pricing, monthly seasonality, scenarios, and financial statements.
Plan product-line output, pricing, operating costs, funding, and cash needs in one forecast before committing assumptions to a business case.
Editable operating inputs feed monthly calculations, financial statements, scenario comparisons, and management reports so you can review how assumption changes flow through the model.
Revenue equals recognized product units multiplied by the matching unit price, allocated through monthly seasonality once, plus any enabled ancillary revenue.
Define each manufactured product line, launch timing, and whether the line is enabled.
Enter produced, saleable, or sold units using the workbook’s sell-through convention.
Multiply recognized sold units by the matching sales price for each product line.
Apply monthly seasonality once to annual inputs and include enabled ancillary revenue.
Sum recognized product-line revenue and ancillary revenue into total manufacturing revenue.
The Revenue sheet captures product-line launch timing, unit volumes, unit prices, and monthly seasonality that feed the model’s recognized sales calculations.
 REVENUE
The OPEX sheet separates variable expenses from fixed recurring costs, with start and end dates, annual assumptions, and monthly forecast timing.
 OPEX
The Scenarios report compares Low, Base, and High cases across revenue, gross margin, contribution margin, and EBITDA over the five-year forecast.
 SCENARIOS
The Dashboard consolidates scenario controls, core financials, revenue mix, profitability, cash flow, and investment payback into one management view.
 DASHBOARD
It fits when units, prices, seasonality, costs, and standard reports match your structure; different revenue logic or reporting may require custom modeling.
The template is a planning starting point, not a guarantee of performance.
Financial Models Lab can build or adapt a model when you need different revenue logic, operating schedules, or reporting requirements.
ORDER A CUSTOM FINANCIAL MODELAfter checkout, you receive the editable Excel and Google Sheets financial model with five-year projections, scenario analysis, and financial reports.
Change operating assumptions and review how updated inputs flow through the forecast.
Plan across five years with monthly detail supporting the model’s financial calculations.
Compare Low, Base, and High cases across key financial performance measures.
Review the Income Statement, Cash Flow Statement, Balance Sheet, and management outputs.
The essential answers are visible in full, with no accordion clicks required.
It calculates each enabled product line from recognized sold units multiplied by its matching sales price, then adds enabled ancillary revenue. Annual inputs are allocated through monthly seasonality once.
You can edit product-line names, launch dates, unit volumes, unit prices, seasonality, and enabled ancillary revenue. The workbook also provides editable operating assumptions.
The Scenarios view compares Low, Base, and High cases for revenue, gross margin, contribution margin, and EBITDA across the forecast.
The model includes the Income Statement, Cash Flow Statement, Balance Sheet, Dashboard, Summary, and multiple analytical reports.
Yes. Financial Models Lab can build or adapt a model when you need different revenue logic, operating schedules, or reporting requirements.
It is a planning forecast, not a guarantee of business performance or financial outcomes. Results change with the assumptions you enter.
You get a comprehensive Excel and Google Sheets template for a biomass power plant financial model, complete with pre-populated industry data, a dynamic dashboard, and investor-ready financial statements.
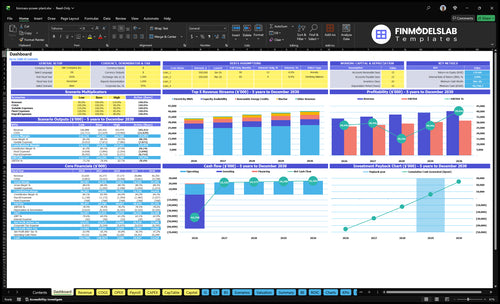
Core inputs and core outputs
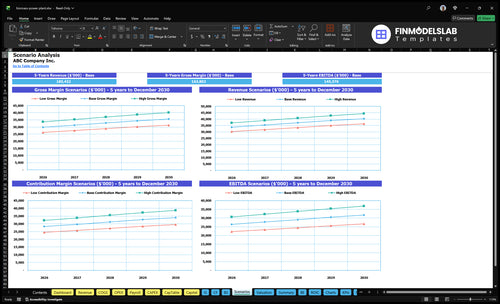
Three scenario analysis

Presentation ready
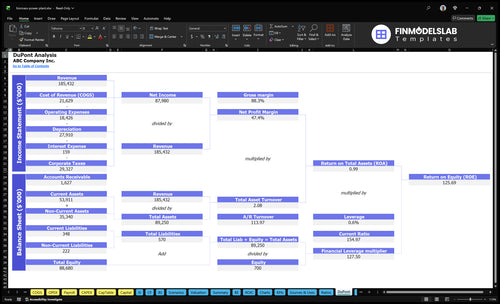
DuPont analysis
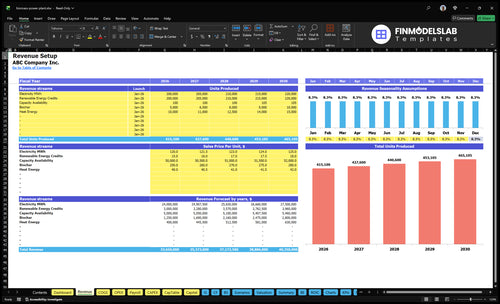
Researched revenue assumptions
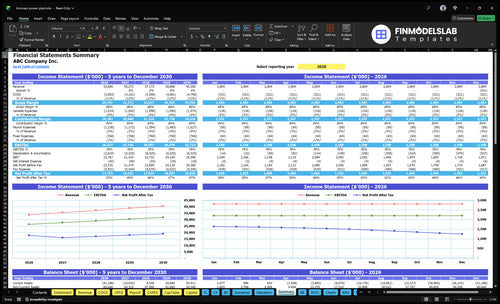
Lender-friendly financial outputs
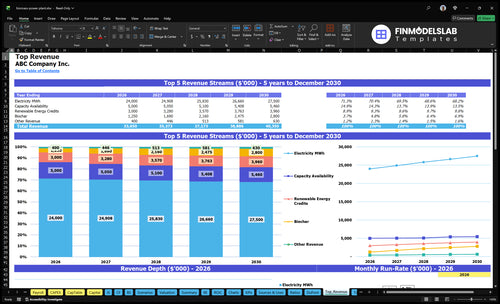
Revenue stream detailed view
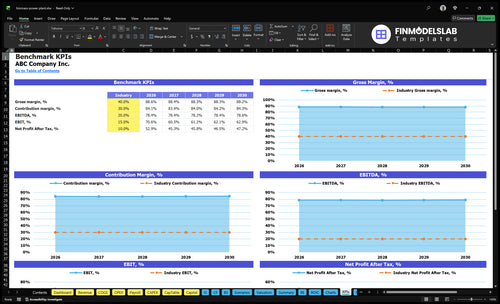
Performance metrics benchmark

This model helped me map runway and shortfalls without guessing, so I could plan funding timing with more confidence. I cut a full day of manual cash checks and had a cleaner answer ready for our lender call.
I finally had statements and charts in one file instead of chasing versions across folders. It saved me about 4 hours a week and made monthly reporting much easier to share with our team.
I’m not great with advanced Excel, and this template made the modeling side much less intimidating. The setup was straightforward, and I had my first draft built in under 2 hours.