

Forecast Visits
Enter visits per operating day or period and the applicable operating days or periods.


This editable Excel and Google Sheets workbook converts salon visits, operating days, seasonality, service mix, pricing, and extra revenue into a five-year forecast with statements and scenarios.
Plan salon traffic, service mix, pricing, extra revenue, operating costs, staffing, capital needs, and financial performance in one linked forecast.
Change launch timing, visits per day, operating days, seasonality, category mix, service prices, and extra revenue; linked schedules and reports update from those assumptions.
The model forecasts one shared visit pool, applies operating days and seasonality, allocates visits by service mix, prices each category, and adds enabled extra revenue once.
Enter visits per operating day or period and the applicable operating days or periods.
Convert the shared service-unit forecast into monthly volume using the seasonality schedule once.
Split the shared visit pool across service categories according to the entered sales mix.
Multiply allocated visits by each category price and add enabled extra revenue per visit once.
Sum service-category revenue and enabled extra revenue across all forecast periods.
The Revenue Assumptions worksheet links launch timing, visits per day, operating days, seasonality, service-category mix, prices, and extra revenue per visit to sales.
 REVENUE ASSUMPTIONS
The COGS & Operational Expenses worksheet separates revenue-linked COGS, variable expenses, and fixed expenses with start dates, end dates, and forecast timing.
 COGS & OPERATIONAL EXPENSES
The Scenario Analysis view compares Low, Base, and High paths for revenue, gross margin, contribution margin, and EBITDA across the five-year forecast.
 SCENARIO ANALYSIS
The Dashboard combines general setup, debt and working-capital controls, scenario multipliers, revenue mix, profitability, cash flow, core financials, and payback in one view.
 DASHBOARD
The template fits visit-based salons that allocate one service-unit pool by service mix and price, while materially different operating logic may require custom modeling.
The template is a planning starting point, not a guarantee of performance.
Financial Models Lab can build or adapt a model when you need different salon revenue logic, operating schedules, or reporting from the ready-made template.
ORDER A CUSTOM FINANCIAL MODELYou receive an editable Excel and Google Sheets workbook with five-year projections, Low/Base/High scenarios, linked financial statements, and instant download.
Update launch timing, visits, operating days, seasonality, service mix, prices, extra revenue, costs, staffing, capital, and financing assumptions.
Review five forecast years with monthly and annual financial detail.
Compare Low, Base, and High cases across revenue and profitability measures.
Use linked Income Statement, Cash Flow Statement, Balance Sheet, Dashboard, and Summary reporting views.
The essential answers are visible in full, with no accordion clicks required.
It forecasts a shared visit pool, applies operating days and seasonality, allocates visits by service mix, multiplies each category by its price, and adds enabled extra revenue once.
You can change launch date, visits per day, operating days, monthly seasonality, service-category mix, category prices, and enabled extra revenue per visit.
You can compare Low, Base, and High paths for revenue, gross margin, contribution margin, and EBITDA in the Scenario Analysis view.
The product shows linked Income Statement, Cash Flow Statement, Balance Sheet, Dashboard, Summary, and scenario reporting views.
Yes. Financial Models Lab offers custom financial modeling when you need different revenue logic, operating schedules, or reporting structures.
It is an editable financial forecast based on the assumptions entered into the workbook, not a guarantee of business performance or financial results.
This comprehensive Excel template for a blow dry bar startup budget includes everything you need to build a robust financial plan, from detailed revenue forecasts and expense schedules to complete financial statements and performance dashboards.
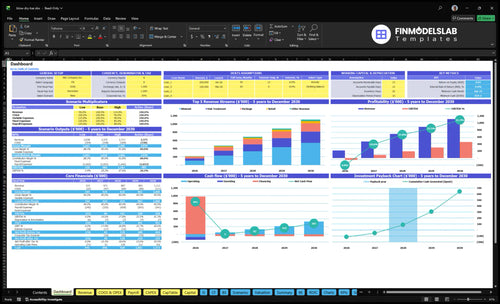
Core inputs and core outputs

Three scenario analysis

Presentation ready
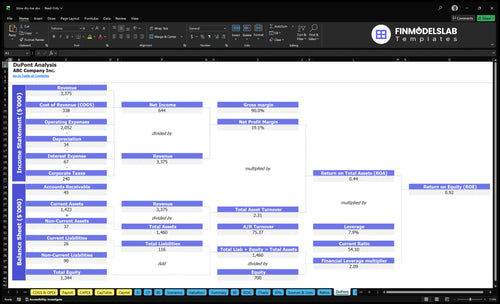
DuPont analysis
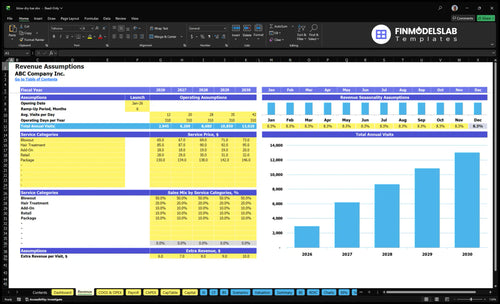
Researched revenue assumptions
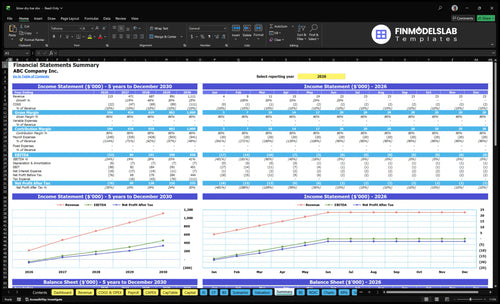
Lender-friendly financial outputs
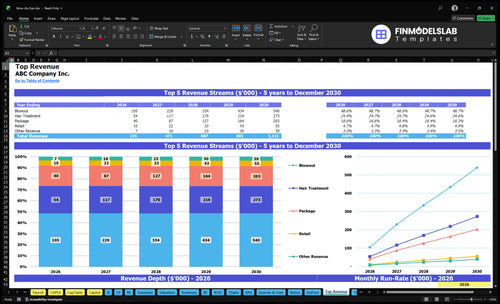
Revenue stream detailed view

Performance metrics benchmark

This template cut my buildout time from days to a few hours, so I could focus on pricing and staffing instead of rebuilding spreadsheets. One clean place for the numbers made the whole process much easier.

I stopped worrying about one bad cell throwing off the whole model. The layout made it easy to check inputs and move forward with a cleaner forecast in less time.
I wasn’t sure what investors would want to see, but this model gave me a clear structure right away. I had the numbers ready for a meeting without guessing at the format.