

Allocate Land
Multiply total cultivated area by each crop allocation percentage.


The Blueberry Farming Financial Model is an editable 10-year workbook linking farm operating drivers to statements, scenarios, and management reporting.
Plan blueberry farm revenue from cultivated area, crop allocation, harvest timing, yield, losses, sales timing, and selling prices across the forecast.
Editable assumptions flow through operating schedules into the Income Statement, Cash Flow Statement, Balance Sheet, scenario comparisons, and dashboard outputs.
Revenue converts cultivated land, crop allocation, harvest frequency, saleable yield, sales timing, and selling price into crop sales across the 10-year model.
Multiply total cultivated area by each crop allocation percentage.
Count marked harvest months to determine harvests per crop each year.
Multiply allocated area by yield per harvest and harvest count, then apply yield loss.
Recognize harvest proceeds after any stated sales-cycle lag without changing physical yield.
Multiply net saleable yield by selling price and add revenue across crop categories.
The Revenue Assumptions sheet links cultivated area, crop allocation, harvest timing, yield loss, sales timing, and selling prices to the farm revenue calculation.
 REVENUE ASSUMPTIONS
The COGS & Operational Expenses sheet separates direct production costs, variable operating costs, and fixed expenses for monthly and annual planning.
 COGS & OPERATIONAL EXPENSES
The Scenario Analysis view compares Low, Base, and High cases across revenue, gross margin, contribution margin, and EBITDA over the forecast period.
 SCENARIO ANALYSIS
The Dashboard combines model setup, scenario controls, revenue mix, profitability, cash flow, and investment metrics in one management reporting view.
 DASHBOARD
The ready-made model fits farms using land, harvest, yield, loss, sales-lag, and price drivers; structural changes may call for custom modeling.
The template is a planning starting point, not a guarantee of performance.
Financial Models Lab can build or adapt a model when you need different revenue logic, operating schedules, or financial reporting.
ORDER A CUSTOM FINANCIAL MODELYou receive an instantly downloadable, fully editable Excel or Google Sheets financial model with 10-year projections, scenarios, statements, and reports.
Open and edit the model in Excel or Google Sheets.
Plan operating and financial performance across the full 10-year projection horizon.
Compare Low, Base, and High cases across core financial measures.
Review the Income Statement, Cash Flow Statement, Balance Sheet, and management views.
The essential answers are visible in full, with no accordion clicks required.
It converts allocated cultivated area, harvest frequency, yield, yield loss, sales timing, and selling price into crop revenue, then sums crop categories.
You can edit the start date, units, cultivated area, land allocation, yield, harvest months, yield loss, sales-cycle lag, and selling prices.
You can compare alternative cases across revenue, gross margin, contribution margin, and EBITDA over the 10-year forecast.
The product confirms an Income Statement, Cash Flow Statement, Balance Sheet, Dashboard, Scenario Analysis, Summary, and additional financial reports.
Yes. Financial Models Lab offers custom financial modeling when different revenue logic, operating schedules, or reporting structures are required.
It is a planning forecast based on editable assumptions, not a guarantee of business performance or financial results.
You get a complete financial planning toolkit designed specifically for a blueberry farming feasibility study in Excel.
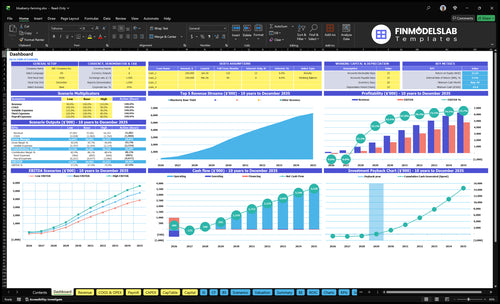
Core inputs and core outputs
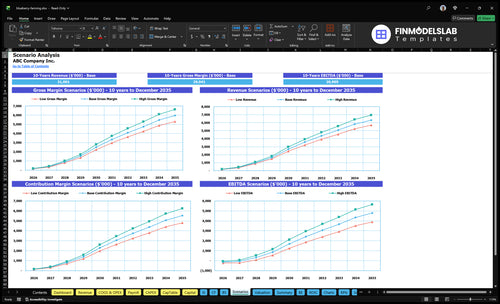
Three scenario analysis
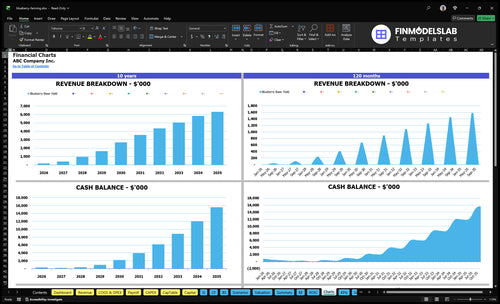
Presentation ready
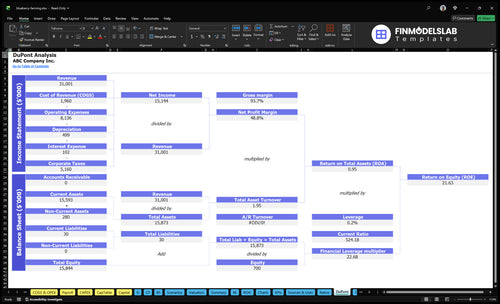
DuPont analysis
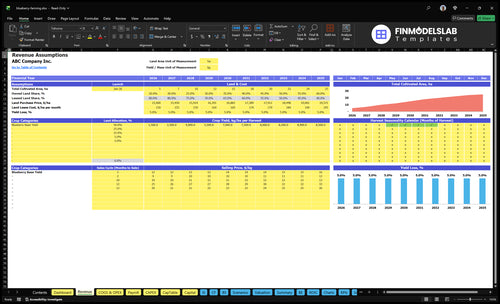
Researched revenue assumptions
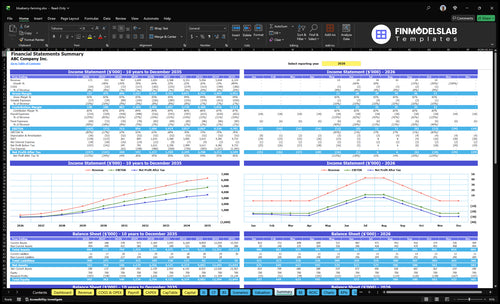
Lender-friendly financial outputs
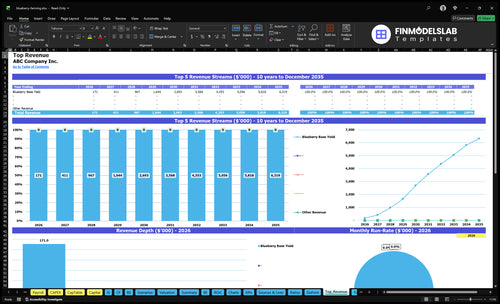
Revenue stream detailed view
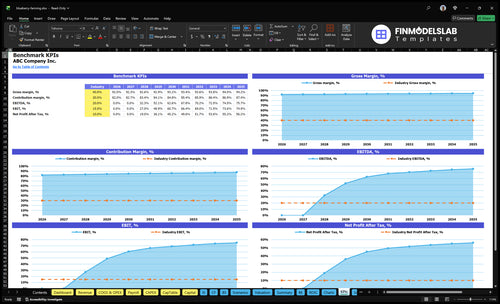
Performance metrics benchmark

The low, base, and high cases were all laid out clearly, so I stopped second-guessing the numbers. It saved me a couple of hours every time I updated the blueberry plan.
I’m not an Excel person, but this template kept the inputs clear and the tabs easy to follow. I had a clean five-year forecast ready for a lender call in one afternoon.
The checks and organized formulas gave me more confidence when I edited the file. I caught issues fast and walked into my investor meeting with a model I could trust.