

Revenue and Calc
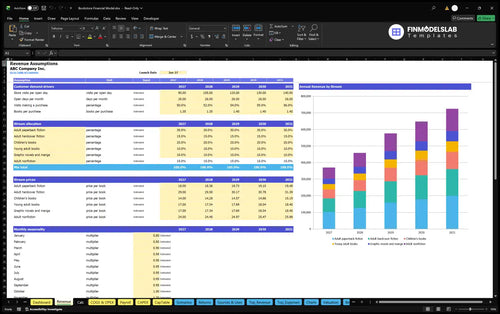
Edit launch timing, visits, purchase conversion, basket size, six category allocations, prices, and seasonality. Monthly calculations connect one shared pool of book sales to the annual revenue forecast.


The Bookstore Financial Model is an Excel template that turns store visits, purchase conversion, books per transaction, category prices, and seasonality into monthly calculations and five-year revenue and EBITDA projections for an independent bookstore.
The illustrated case is a 1,500-square-foot store selling only new printed books in six categories, with no cafe, gifts, or invoiced institutional sales. It launches in January 2026, uses nominal U.S. dollars, and represents estimates rather than observed performance.
The workbook connects bookstore-specific sales and spending assumptions with monthly schedules, financial statements, and management reports.
Edit launch timing, visits, purchase conversion, basket size, six category allocations, prices, and seasonality. Monthly calculations connect one shared pool of book sales to the annual revenue forecast.
Separate wholesale books, freight, and damage from payment fees, checkout supplies, and fixed store expenses. The schedule distinguishes percentage-of-revenue costs from monthly budgets.
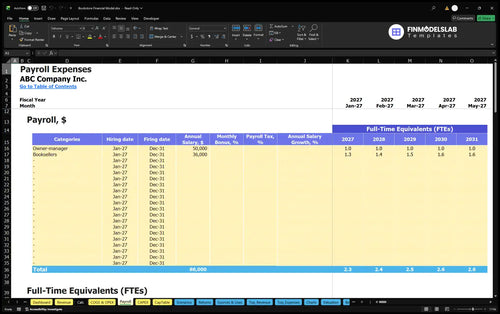
Plan owner and bookseller FTE and base pay separately from book stock. Schedule fixtures, fit-out, and equipment on CAPEX.
Review income statement, cash flow, and balance sheet functions. Only revenue, operating expenses, and EBITDA figures are provided for the illustrated bookstore case.
Monthly book sales are calculated from store visits, purchase conversion, books per purchase, seasonal demand, and the realized selling price of each category.
The 2026 example assumes 90 daily visits, 26 open days monthly, 50% purchase conversion, and 1.35 books per purchase. By 2030, those drivers rise to 140 daily visits, 56% conversion, and 1.4 books per purchase.
Book units divide among adult paperback fiction (30%), adult hardcover fiction (15%), children’s books (20%), young adult books (10%), graphic novels and manga (10%), and adult nonfiction (15%). Together these shares total 100%, so categories never duplicate a book sale.
The Revenue Forecast organizes store traffic, conversion, books per purchase, seasonality, and category prices into a book-unit and sales forecast. Edit these inputs to test whether higher foot traffic or a different price and category mix supports the planned sales level.
90 daily visits × 26 open days × 50% conversion × 1.35 books per purchase × 12 seasonality-weighted months = 18,954 books.
Opening prices range from $14 for children’s books to $29 for hardcover fiction, yielding a $19.55 weighted realized price in 2026. January and February use 0.8 seasonal multipliers and December uses 1.6; all twelve factors sum to 12.
Sales exclude sales tax and are net of normal customer returns. Prelaunch months produce no modeled revenue.
The operating forecast deducts merchandise-related costs, variable checkout costs, fixed store spending, and employee compensation without counting staff costs twice.
Wholesale books are modeled at 59% of revenue, inbound and return freight at 1%, and damaged or missing stock at 0.5%. Together, these direct costs equal 60.5% of revenue before additional sales-related expenses.
Payment processing costs 2.8% of sales and checkout consumables another 0.3%. Fixed budgets separately cover rent, utilities, insurance, software, professional services, marketing, maintenance, communications, licenses, and security.
The COGS and Operating Expenses forecast keeps book merchandise, freight, payment fees, and ongoing store overhead in distinct expense groups. It helps users see how pricing or traffic changes affect direct costs and how monthly rent and other fixed charges affect EBITDA.
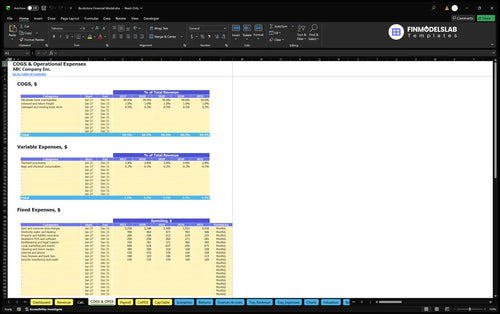
Annual fixed costs are $69,600 in 2026, including monthly rent and common-area charges of $3,250. By 2030, fixed costs reach $78,336.
The Payroll Forecast models an owner-manager at one full-time-equivalent position with $50,000 annual base pay, plus booksellers at 1.3 to 1.6 annual-average FTE with $36,000 base pay per FTE. In this example, payroll runs from $96,800 in 2026 to $107,600 in 2030.
Opening funds cover store fit-out, equipment, launch payments, initial working capital, and a planning reserve rather than representing sales or EBITDA.
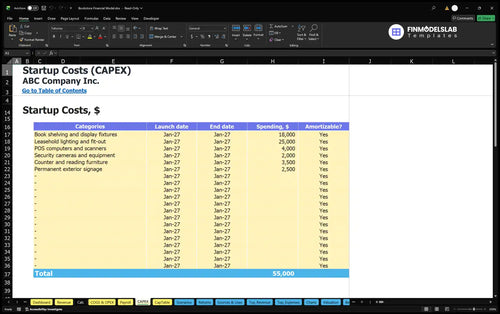
Opening assets include shelving and displays ($18,000), leasehold fit-out ($25,000), POS equipment ($4,000), and security systems ($2,000). Other assets include furniture and signage, while separate opening cash covers deposits, permits, launch activity, and training.
Working-capital controls assume zero receivable days, 30 payable days, and 118 inventory days. Inventory ties up cash before book sales generate customer receipts.
The Capital Expenditure Plan schedules store equipment and fit-out purchases and tracks depreciation for eligible assets. It distinguishes opening investment in shelving, lighting, computers, and security equipment from the recurring costs of selling books.
Illustrative owner funding is $231,632, based on opening assets, other cash payments, initial working capital, and a three-month reserve less confirmed outside financing. This reserve is a planning budget, not a tested peak-cash requirement.
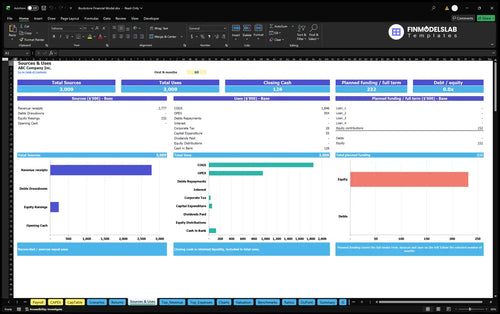
The Sources and Uses of Funds report explains how equity, debt, and customer receipts are allocated among operating payments, investment, financing, and retained cash. It helps distinguish financing an opening inventory position from generating a profitable operating result.
The documented bookstore scenario moves from an operating EBITDA loss in 2026 to positive EBITDA in 2028, under its stated traffic, pricing, and expense assumptions.
| Year | Revenue | Operating Expenses | EBITDA |
|---|---|---|---|
| 2026 | $370,551 | $402,070 | -$31,520 |
| 2027 | $458,594 | $463,754 | -$5,160 |
| 2028 | $575,773 | $544,030 | $31,743 |
| 2029 | $647,969 | $595,762 | $52,207 |
| 2030 | $724,610 | $646,787 | $77,822 |
Illustrative Base-case outputs rounded to the nearest whole dollar; minor displayed differences arise from rounding.
Revenue grows as traffic, conversion, basket size, and prices increase. In 2028, this sales expansion exceeds growth in merchandise costs, payment fees, overhead, and wages, producing positive EBITDA.
EBITDA excludes depreciation, interest, and taxes; it does not establish net profit, cash sufficiency, or investment payback. Inventory, CAPEX, and financing can create cash requirements even during EBITDA-positive periods.
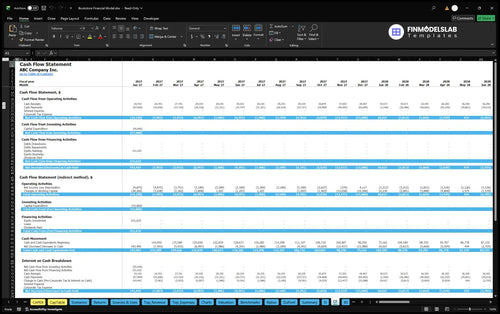
The Cash Flow Forecast tracks monthly operating, investing, and financing cash movements and reconciles beginning and ending cash. Users can examine inventory purchases, equipment spending, debt servicing, and equity funding separately from the operating EBITDA values shown above.
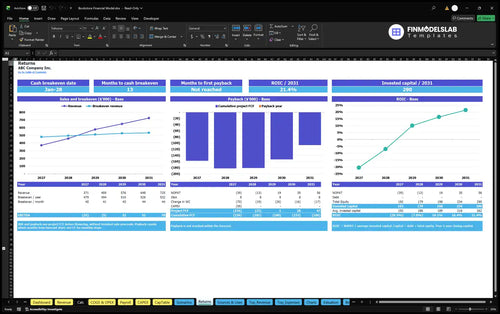
The workbook includes tools to evaluate the revenue needed to cover costs, the timing of cash recovery, and return on invested capital as separate questions.
Sales break-even concerns operating cost coverage; cash break-even concerns receipts and payments. Investment payback examines cumulative project cash flow, while annual ROIC measures returns relative to invested capital. EBITDA alone establishes none of these metrics.
The Returns report brings together sales break-even, cash break-even timing, investment payback, and annual ROIC. Test alternative bookstore traffic and cost assumptions, then review the report rather than assuming that an EBITDA-positive year also means the owner has recovered the initial investment.
Low, Base, and High cases can stress sales, direct costs, checkout fees, fixed charges, and payroll. Valuation and benchmark reports are also included, but this example provides no valuation, benchmark, or return result.
These answers clarify the operating scope, editable drivers, and interpretation of the workbook reports.
Yes. Change visits, conversion, basket size, category mix, prices, seasonality, and launch timing to update revenue.
No. The documented case sells new print books across six categories and excludes cafe sales, gifts, and invoiced institutional customers.
Wholesale stock is reflected in direct costs; inventory and payable days also inform working capital and cash-flow schedules.
Yes. Owner-manager and bookseller FTE and base salaries are forecast separately from wholesale book costs.
No. The figures are illustrative projections from estimated assumptions for 2026 through 2030, not historical bookstore results or industry averages.
No. EBITDA excludes depreciation, interest, and tax, while cash flow also reflects working capital, investments, and financing movements.
Yes. Returns calculates investment payback from project cash flows, but this example establishes no payback date or return percentage.
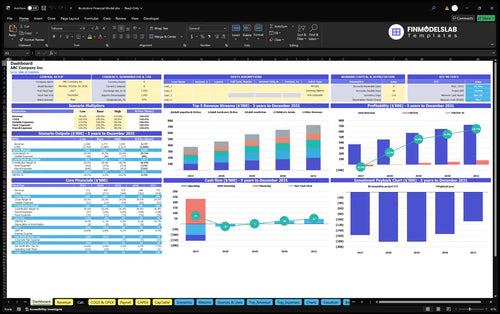
KPIs, forecasts, and cash flow at a glance.
Key assumptions and calculations driving revenue forecasts.
Funding sources, spending, and closing cash.
Cash break-even, payback, and ROIC.
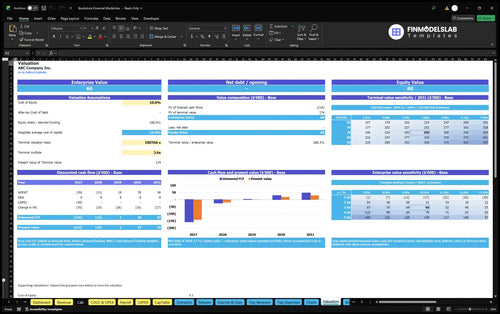
DCF valuation and sensitivity analysis.
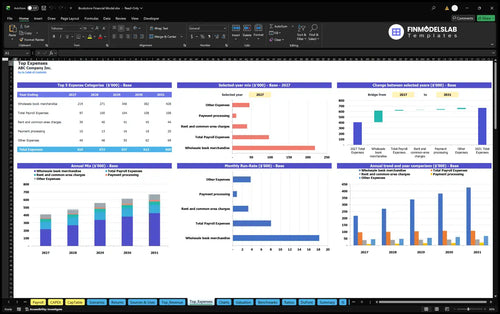
Largest costs and spending trends.
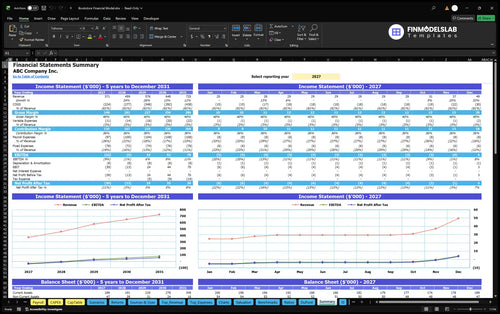
Annual and monthly financial performance.
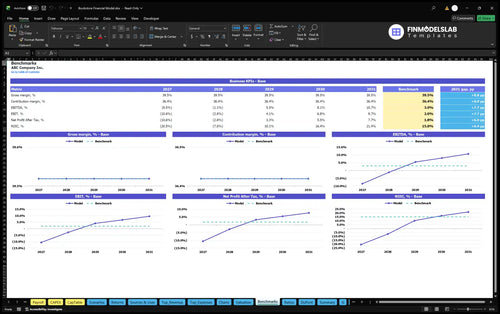
Compare margins and returns to benchmarks.

Starting from scratch felt overwhelming, but this template gave me a clean place to begin. I had a working bookstore model in under two hours instead of spending days guessing what to build.

I wasn’t sure what investors would expect, and this model laid out the right structure right away. It helped me shape a pitch deck with clearer assumptions and saved me from rebuilding the forecast later.
My statements and charts were scattered across files before I found this template. Now everything sits in one workbook, and I pulled together a clean monthly report in less than an hour.