

Revenue and Calc
Set monthly customer purchases, five mutually exclusive bridal baskets, basket prices, seasonality, and launch timing; monthly calculations consolidate sales without counting the same purchase twice.


The Bridal Shop Financial Model is an Excel planning template for a US ready-stock bridal boutique selling wedding gowns, veils, ensembles, samples, and accessories. It translates completed customer purchases and basket prices into monthly revenue and a five-year financial forecast for 2026 through 2030.
The illustrated case is a leased, 2,000-square-foot suburban showroom launching January 31, 2026. Customers pay in full at collection; the operating case excludes custom-order production and in-house alterations, so revenue is driven by completed purchases rather than alteration capacity.
The workbook connects bridal sales assumptions, showroom operating costs, opening investments, financing controls, and management reports.
Set monthly customer purchases, five mutually exclusive bridal baskets, basket prices, seasonality, and launch timing; monthly calculations consolidate sales without counting the same purchase twice.
Plan gown procurement, freight, packaging, payment processing, sales marketing, shrinkage, fixed showroom overhead, and staffing costs in their separate schedules.
Review annual and monthly results, adjust Low, Base, and High revenue and cost multipliers, and select the operating case displayed in management reporting.
Use CAPEX, CapTable, Debt, Sources & Uses, and working-capital controls to distinguish showroom setup, opening inventory, owner equity, loan schedules, and operating cash needs.
Income Statement, Cash Flow, Balance Sheet, Summary, Returns, Valuation, Charts, Benchmarks, and reconciliation checks support deeper review without implying unsupplied case results.
Monthly customer purchase volume is divided among five exclusive baskets, then multiplied by each basket price and a monthly seasonality factor.
The Base case plans 30 completed purchases per average month in 2026, increasing to 36, 42, 48, and 54 in subsequent years. One completed sale belongs to one basket only; gown-and-veil and full-ensemble purchases are not added again as separate gown sales.
The purchase mix is 25% gown-only, 25% gown with veil, 25% complete ensemble, 10% sample gown, and 15% accessories-only. Selected prices are $1,800, $2,150, $2,550, $1,000, and $250, respectively.
The Revenue Forecast organizes purchase counts, basket allocation, individual basket prices, and sales totals. Revenue and Calc translate these operating inputs into monthly revenue streams and annual forecasts.

30 average monthly purchases × $1,762.50 weighted basket price × 12.0 summed monthly seasonality factors = $634,500 annual revenue.
The seasonality settings run from 1.20 in January and February to 0.85 in November and December, with the twelve multipliers totaling 12.0. Change the demand plan, price points, mix, or seasonal pattern to test how different bridal buying behavior changes projected sales.
Revenue-linked acquisition costs and selling expenses combine with monthly showroom overhead and role-based staffing to produce operating EBITDA.
The illustrative COGS assumptions are 46% of sales for gowns and accessories, 2.5% for inbound freight and duties, and 0.5% for packaging: 49% of revenue in total. Selling expenses add 2.9% processing, 6.5% marketing, and 1% shrinkage, totaling 10.4%.
The COGS and Operating Expenses Forecast separates merchandise acquisition, freight, and packaging from variable selling expenses and recurring showroom overhead. It helps evaluate the sensitivity of contribution margin to inventory costs and marketing intensity.

Fixed overhead totals $72,000 per year in the illustrated case and covers the lease, utilities, insurance, retail software, compliance, cleaning, fixture care, and administration. The showroom lease assumption includes $4,000 monthly occupancy cost; the other fixed categories complete the annual total.
The Payroll Forecast shows planned staff FTE and salary costs by role, separately from merchandise costs and fixed overhead. It supports changes in stylist coverage as transaction demand grows.
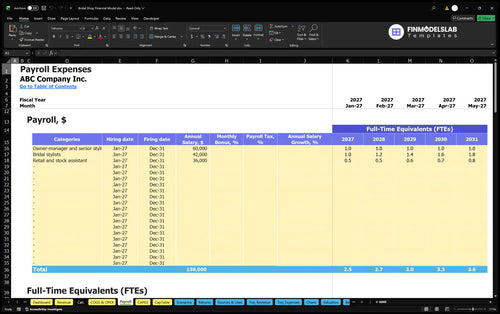
Payroll starts with one owner-manager at $60,000, one bridal stylist at $42,000, and a 0.5-FTE retail assistant at a $36,000 annual full-time base. The resulting 2026 payroll is $120,000; rising stylist and assistant FTE bring the illustrated 2030 payroll to $164,400.
Payroll is counted once, not duplicated in COGS, variable selling expenses, or fixed overhead. Employer payroll taxes and benefits are excluded from this particular assumption case, even though the standard workbook contains personnel-related input controls.
Startup investment and working capital are modeled separately from the ongoing expense categories used to calculate EBITDA.
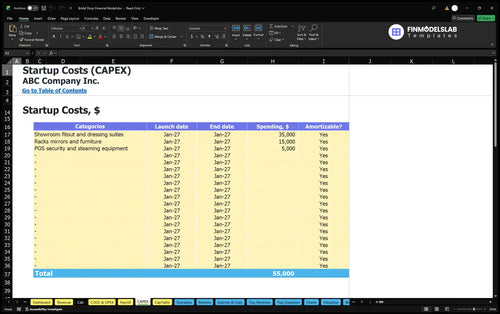
The opening plan allocates $35,000 to showroom fitout and dressing suites, $15,000 to racks, mirrors, and furniture, and $5,000 to POS, security, and steaming equipment. These $55,000 of startup assets are not recorded again as 2026 operating expenses.
The Capital Expenditure Plan records individual asset purchases, spending dates, and depreciation treatment. It separates showroom investment from the recurring costs of selling bridal merchandise.
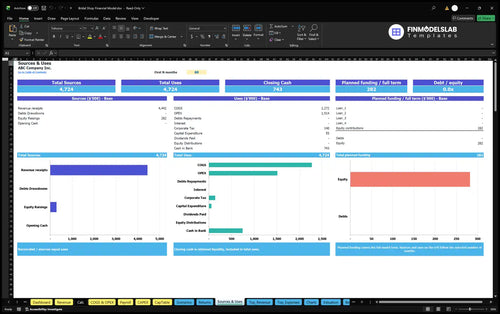
The illustrated owner funding is $282,108, covering $55,000 of assets, $21,000 of other opening cash, $63,885 of net opening stock, and $142,223 of reserve, with no external funding committed. Its cash allocation is a startup planning assumption, not a finding of adequate liquidity.
Sources and Uses of Funds traces modeled financing sources against showroom setup, stock investment, operating outflows, and remaining cash. Dashboard debt controls and CapTable entries permit alternative loan and owner-equity structures.
The Base operating case projects increasing purchase volume and revenue while separating direct, variable, fixed, and payroll spending.
| Year | Revenue | Operating Expenses | EBITDA |
|---|---|---|---|
| 2026 | $634,500 | $568,893 | $65,607 |
| 2027 | $761,400 | $652,672 | $108,728 |
| 2028 | $888,300 | $740,050 | $148,250 |
| 2029 | $1,015,200 | $827,429 | $187,771 |
| 2030 | $1,142,100 | $914,807 | $227,293 |
Figures are illustrative model outputs rounded to whole dollars; rounding can affect displayed differences.
In this example, 2026 EBITDA is $65,607 on $634,500 of revenue. By 2030, revenue reaches $1,142,100 and EBITDA reaches $227,293, reflecting the specified higher completed-purchase demand against the modeled cost structure.
EBITDA is operating earnings before depreciation, interest, and taxes. It is not net profit or cash flow; the annual table does not establish a cash balance, tax outcome, debt service, or investment payback result.
The Cash Flow Forecast organizes operating receipts and payments, capital spending, debt activity, and equity funding into monthly cash movements. Use it to investigate whether timing of stock purchases, collections, and financing creates potential liquidity gaps.
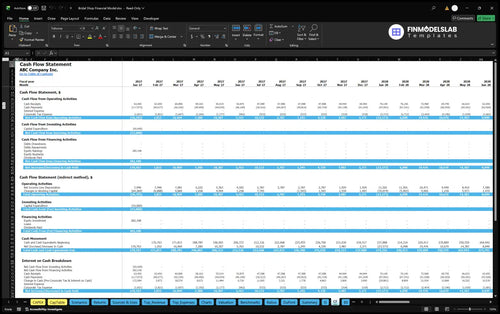
The Income Statement displays the broader profit-and-loss progression beyond EBITDA, while the Balance Sheet tracks inventory, payables, cash, and funding balances. Those standard reports provide analysis functions, but no additional case-specific amounts are asserted here.
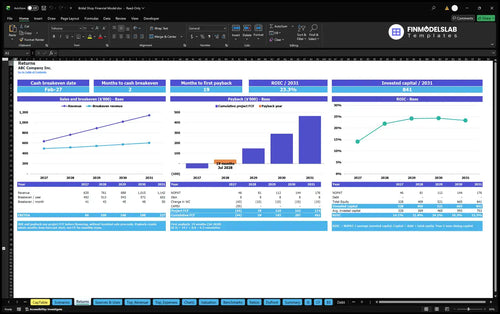
Separate sales break-even, cash break-even, investment payback, and annual return on invested capital instead of treating EBITDA as an investment return.
Sales break-even compares the bridal boutique’s cost structure with the revenue needed to cover operating costs. Cash break-even tests the timing of cash generation, while investment payback measures recovery of invested funding; annual ROIC evaluates operating returns relative to invested capital.
The Returns analysis compares break-even requirements, project cash flow, cumulative investment recovery, and return on invested capital. It supports financing and investment questions without implying any particular payback date or ROIC for this illustrative bridal case.
Scenario controls on Dashboard apply Low, Base, and High multipliers separately to revenue, COGS, variable costs, fixed costs, and payroll. This allows testing of slower gown sales, higher purchase costs, or additional stylist coverage without confusing one input with another.
Financial Scenario Analysis compares Low, Base, and High revenue, margins, and EBITDA across the forecast. It helps identify which combinations of bridal demand and operating costs most affect the modeled profitability path.

The template fits owners, analysts, and advisers evaluating a bridal showroom with full-payment sales and owned ready-to-sell inventory.
Use the model to compare purchase growth, gown-versus-accessory mix, procurement cost changes, marketing intensity, stylist staffing, and showroom funding. It is especially relevant when inventory must be acquired before sales and the business does not earn custom-order or in-house alterations revenue.
Answers to common questions about the inputs, revenue mechanics, staffing, reports, and financial results.
Yes. Edit the five basket prices and the allocation percentages that divide each completed customer purchase among mutually exclusive sales types.
No. The illustrated operating case covers ready-stock gowns and accessories, without custom-order production or in-house alterations revenue.
The Revenue and Calc worksheets apply monthly seasonality factors to the annual-average monthly purchase forecast, then sum monthly sales into annual totals.
No. Salaries for the owner-manager, bridal stylists, and retail assistant are recorded through Payroll and are not counted again in COGS or fixed expenses.
No. EBITDA excludes depreciation, financing, taxes, and the timing of working-capital and capital cash flows; consult the Cash Flow report separately.
Yes. The model includes inventory-day, payable-day, and receivable-day controls, capital spending, owner contributions, debt schedules, and Sources & Uses reporting.
No. The 2026–2030 figures are illustrative estimated model forecasts, not historical results or independently verified industry averages.
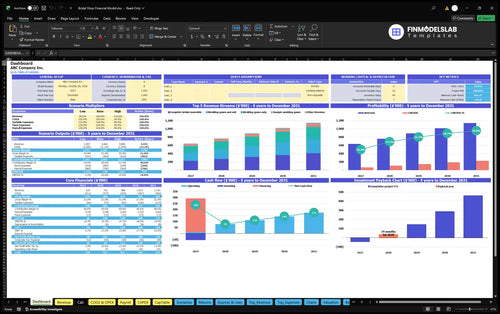
KPIs, forecasts, and cash flow at a glance.
Key assumptions and calculations driving revenue forecasts.
Funding sources, spending, and closing cash.
Cash break-even, payback, and ROIC.
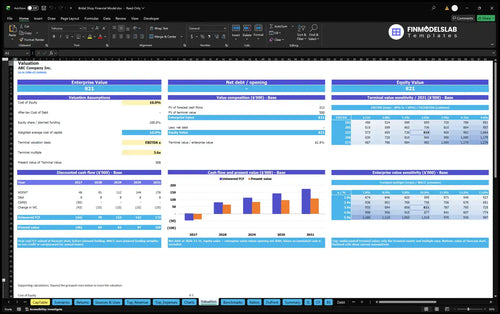
DCF valuation and sensitivity analysis.

Largest costs and spending trends.

Annual and monthly financial performance.
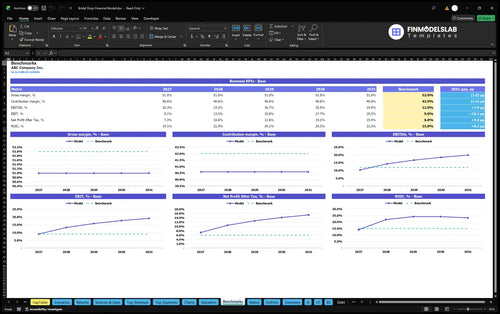
Compare margins and returns to benchmarks.

I used to have statements and charts spread across too many files, and this pulled everything into one place. It made our bridal shop reporting easier to review and cut prep time for the owner meeting by hours.

Building the projections by hand was eating up my week, but this template handled the heavy lifting. I saved about 8 hours on the first pass and had a clean model ready for our lender call.
Starting from scratch felt like too much, and this gave me a structure I could actually work with. I went from stuck to a full five-year forecast in one afternoon, which made the planning process feel manageable.