

Revenue & Calc
Set drinks per day, trading days, product mix, prices, seasonal factors, and launch timing. Monthly calculations distribute demand across six complete-drink categories before aggregating annual revenue.


The Bubble Tea Shop Financial Model is an Excel financial planning template for one independent US bubble tea shop. It connects daily drink demand, menu pricing, recipe mix, seasonality, staffing, operating costs, and startup investment to a monthly forecast and financial reports.
The illustrative case assumes a leased 900-square-foot suburban shop with takeaway service, 12 incidental seats, and no franchise royalties or delivery marketplace. Its planning period is 2026 through 2030; the operating assumptions are editable estimates, not observed sales or industry averages.
Linked inputs, calculations, financial statements, funding schedules, and analytical reports support planning.
Set drinks per day, trading days, product mix, prices, seasonal factors, and launch timing. Monthly calculations distribute demand across six complete-drink categories before aggregating annual revenue.
Edit ingredient, packaging, spoilage, processing, promotions, and fixed shop expenses separately from owner and counter-staff compensation. The staffing schedule handles FTE changes and hiring dates.
Plan fit-out and equipment purchases, equity contributions, and optional financing facilities. Related schedules track capital spending, depreciation, debt drawdowns, interest, and repayment mechanics.
Review financial statements, scenarios, break-even, returns, valuation, charts, ratios, benchmarks, and funding reports. Model checks flag inconsistent inputs.
The model calculates each month’s revenue from drinks sold per service day, operating days, seasonality, category shares, and complete-drink prices.
The base case assumes 100 drinks per service day in 2026, increasing to 170 in 2030, with 30 normal service days monthly. A January-to-December seasonal factor ranges from 0.80 to 1.25 and repeats each forecast year.
Six drink categories divide the same demand pool: classic milk tea 30%, fruit tea 25%, brown sugar milk 18%, matcha milk tea 12%, taro milk tea 10%, and slush drinks 5%. Each category uses its own full-drink price; toppings are not a separate revenue line.
The Revenue Forecast connects baseline drink volume, service days, seasonal demand, and menu mix to projected sales by drink category. The Calc sheet applies launch timing and calculates individual monthly revenue streams.
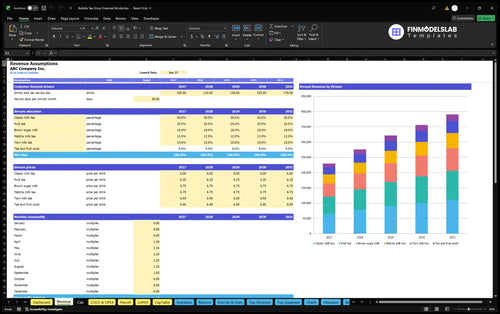
100 drinks/day × 30 service days × $6.385 weighted price = $19,155 in monthly drink sales.
The six weighted menu prices produce an average complete-drink price of $6.385 for this selected mix. Forecast sales start in the chosen launch month, which the model counts as fully active, and are zero beforehand.
Revenue-linked direct costs and selling costs combine with monthly fixed expenses and role-based payroll to determine operating EBITDA.
The COGS and Operating Expenses forecast applies ingredient, packaging, spoilage, payment processing, promotion, and fixed-shop assumptions. In this case, ingredients are 22% of revenue, packaging 5%, spoilage 1.5%, processing 4.8%, and promotions 2%.
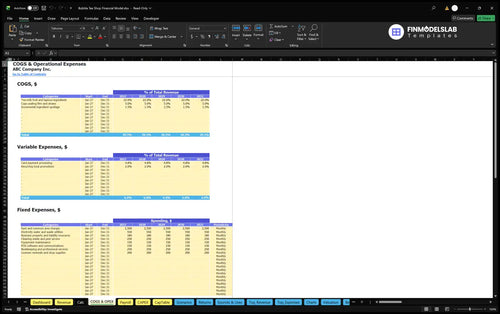
Monthly fixed expenses cover occupancy, utilities, insurance, cleaning, equipment maintenance, software, professional services, and shop supplies. The example includes $2,500 monthly rent and common-area charges; total modeled annual fixed operating costs are $50,760 in both 2026 and 2030.
Direct costs are 28.5% of revenue, while variable operating expenses are 6.8%. Fixed expenses are entered as monthly amounts over paid months; these categories do not include the base salaries already counted in Payroll.
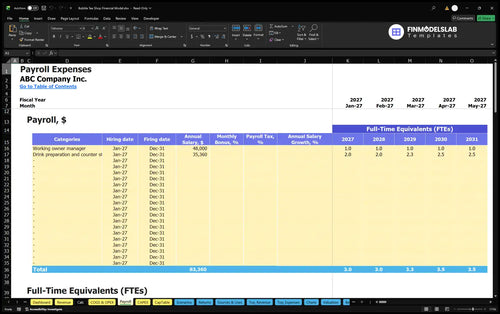
The Payroll Forecast organizes annual-average FTE and salary assumptions by role. The case includes one working owner-manager at $48,000 annually and drink-preparation staff paid $35,360 per FTE, rising from two to 2.5 average FTE by 2030.
The model organizes upfront asset purchases, preopening cash requirements, inventory, working-capital controls, and funding separately from operating expenses.
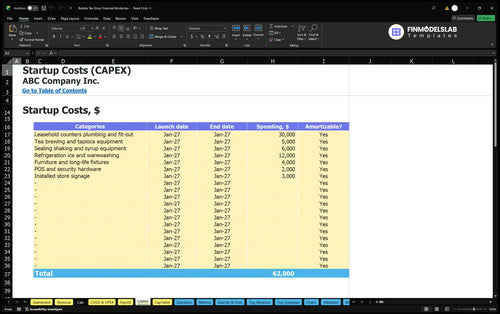
The opening asset plan includes $30,000 for leasehold fit-out, $5,000 for tea and tapioca equipment, $6,000 for sealing and syrup equipment, and $12,000 for refrigeration and warewashing. Furniture, POS hardware, security, and signage are additional capital items.
The Capital Expenditure Plan schedules shop assets by purchase date and cost, with depreciation tracked where applicable. Fit-out, beverage equipment, refrigeration, and long-life fixtures are distinguished from recurring shop operating expenses.
Separate opening cash items include the refundable premises deposit, permits, preopening marketing, training, and utility deposits. Inventory is modeled using 21 inventory days, with zero receivables days and zero payables days in this case.
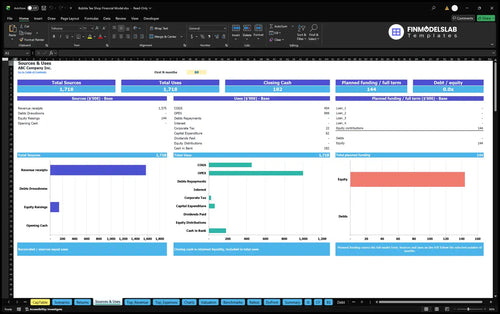
The Sources and Uses of Funds report reconciles planned funding with cash allocated to operations, investment, and financing. The case specifies $143,924 in estimated initial owner funding, including a three-month operating reserve rather than a committed external loan.
The selected planning case projects revenue growth from increasing daily drink volume, while staffing and operating expenses determine the EBITDA path.
| Year | Revenue | Operating Expenses | EBITDA |
|---|---|---|---|
| 2026 | $229,860 | $250,621 | -$20,761 |
| 2027 | $275,832 | $266,849 | $8,983 |
| 2028 | $321,804 | $291,917 | $29,887 |
| 2029 | $356,283 | $312,928 | $43,355 |
| 2030 | $390,762 | $325,099 | $65,663 |
Illustrative USD projections rounded to whole dollars; apparent one-dollar differences can result from rounding.
In this scenario, 2026 operating expenses exceed sales, creating negative EBITDA of $20,761. Projected EBITDA turns positive in 2027 at $8,983 and reaches $65,663 in 2030 as drink volume increases while fixed overhead remains unchanged.
EBITDA is before interest, tax, depreciation, and amortization; it is not historical results, net profit, cash balances, or proof of funding sufficiency.
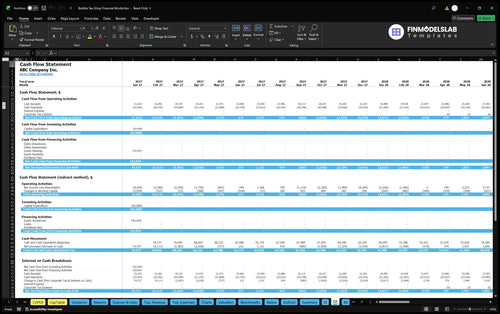
The Cash Flow Forecast presents monthly operating, investing, and financing cash movements, including equity contributions and planned equipment spending. Use it with the Balance Sheet to review funding needs and potential cash shortfalls rather than inferring liquidity from EBITDA.
The linked Income Statement, Summary, and Charts provide additional views of profitability, financial position, and cash generation; their outputs depend on the complete workbook inputs.
The workbook contains distinct tools for operating coverage, cash recovery, invested-capital returns, and sensitivity testing.
The Returns analysis evaluates sales break-even, cash break-even timing, investment payback, and annual return on invested capital. Those measures use different underlying calculations; the selected EBITDA projections do not establish a specific payback date or ROIC.

Sales break-even asks when modeled revenue covers the relevant operating cost base. Cash break-even and payback also consider the timing of actual cash movements and invested funds, so they cannot be read directly from an EBITDA margin.
Debt Controls permit separate financing structures and repayment assumptions. The Valuation report provides discounted cash flow and sensitivity methods, but no specific enterprise value, debt facility, or investor return is claimed for this example.
The Financial Scenario Analysis compares Low, Base, and High assumptions for revenue, COGS, variable and fixed expenses, and payroll. Use these adjustable factors to see how a slower demand ramp or higher costs could change gross margin and EBITDA.

Answers to common questions about editing, calculations, financial reports, and the example shop assumptions.
Yes. Adjust drinks per service day, operating days, the six category shares, menu prices, seasonal factors, and launch timing in the operating inputs.
No. The selected case prices complete drinks by category; toppings are not modeled as an additional revenue stream.
Ingredients, packaging, and spoilage are direct revenue-linked costs. Payment processing and promotions are separate variable operating expenses.
Yes. Payroll includes owner and counter-staff roles, annual-average FTE planning, pay assumptions, and monthly staff-cost schedules.
No. EBITDA excludes financing, taxes, and depreciation; cash flow also reflects investment and funding movements. Review the statements separately.
Yes. Returns includes sales break-even, cash break-even, investment payback, and annual ROIC analysis, with results dependent on the assumptions entered.
No. The 2026–2030 bubble tea shop case uses estimated planning assumptions and illustrative results, not independently verified local averages.
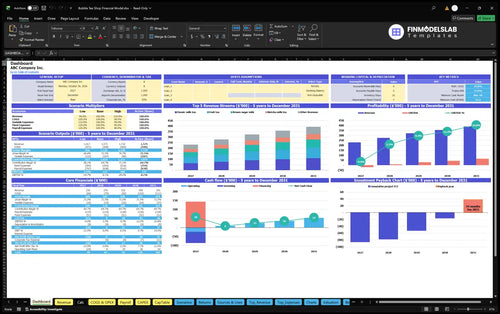
KPIs, forecasts, and cash flow at a glance.
Key assumptions and calculations driving revenue forecasts.
Funding sources, spending, and closing cash.
Cash break-even, payback, and ROIC.
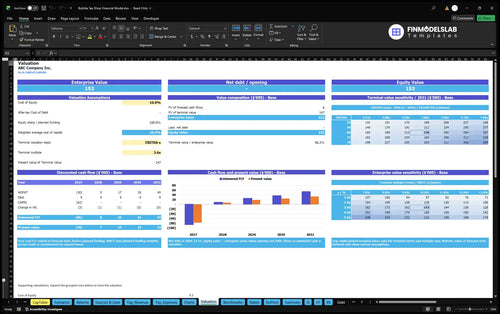
DCF valuation and sensitivity analysis.
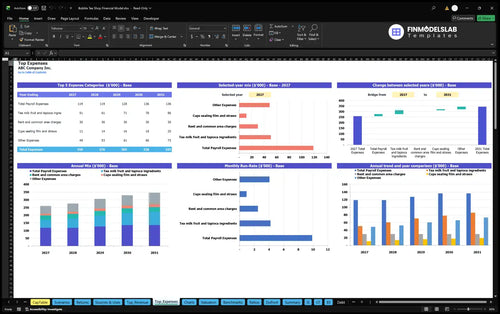
Largest costs and spending trends.
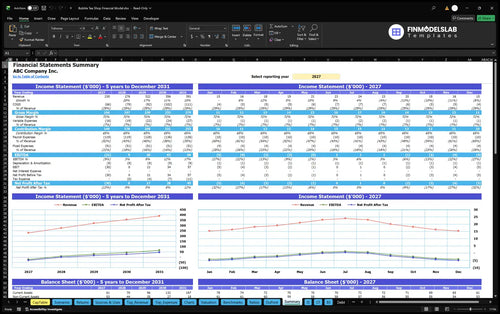
Annual and monthly financial performance.
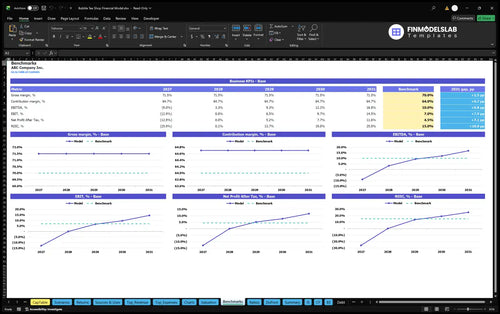
Compare margins and returns to benchmarks.

I stopped hunting through separate files for statements and charts. This template pulled everything into one view and saved me about 4 hours when I needed to share the model with my team.

The margin and break-even tabs made the numbers much easier to follow. I finally had a clear read on profitability before our planning meeting, and it cut my review time in half.
Pricing, cost, and growth inputs were all in one place, so I could clean up my assumptions fast. It made the model easier to explain, and I booked a follow-up meeting with less back and forth.