

Revenue & Calc
Enter trading days, orders per day, category mix, realized menu prices, and opening timing. Monthly calculations allocate the order pool across espresso drinks, brewed drinks, cold drinks, pastries, breakfast combos, and light meals.


The Cafe Financial Model is an Excel-based financial planning template for a single neighborhood counter-service cafe. It connects paid-order demand, an exclusive six-category sales mix, menu prices, food costs, labor, and occupancy expenses to a monthly operating forecast and annual EBITDA projections.
The illustrated case is a leased 1,500-square-foot US cafe in second-generation retail space, with on-premise and takeaway orders paid at the counter. Its 2026–2030 assumptions are editable planning estimates, not historical performance, industry averages, or a prediction for your location.
The workbook links operating assumptions with financial statements and decision-focused reports instead of requiring a separate forecast for each question.
Enter trading days, orders per day, category mix, realized menu prices, and opening timing. Monthly calculations allocate the order pool across espresso drinks, brewed drinks, cold drinks, pastries, breakfast combos, and light meals.
Plan ingredients, packaging, transaction fees, fixed costs, and compensation by role. Base salaries remain separate from other costs, avoiding double counting.
Record equipment purchases, fit-out, owner contributions, and financing. These schedules keep opening investment separate from annual operating expenses.
Use Dashboard model settings and Low/Base/High scenario multipliers to compare margins and EBITDA. Debt controls are also on Dashboard.
Review financial statements, funding, Returns, valuation, charts, and model checks. Supplied case figures are established only through operating EBITDA.
The forecast multiplies trading days by daily paid orders, allocates those orders across six mutually exclusive receipt baskets, and applies the corresponding realized price per order.
The Base case assumes 30 monthly trading days and daily orders rising from 160 in 2026 to 250 in 2030. The mix totals 100%, so every order belongs to one category.
The six shares are espresso drinks 32%, brewed coffee and tea 15%, cold drinks 12%, pastries 12%, breakfast combos 17%, and light meals 12%. Prices can change annually.
The Revenue Forecast brings together paid-order demand, trading days, receipt-category shares, and realized prices. The connected Calc worksheet turns those assumptions into monthly volume and revenue by offering before consolidating total cafe sales.
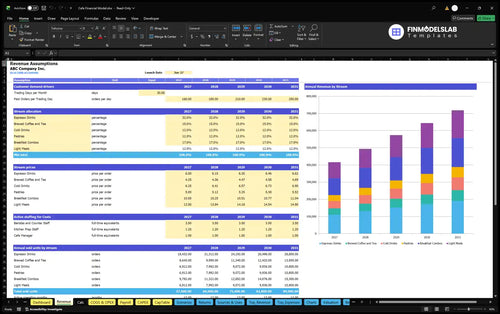
30 trading days × 160 paid orders per day = 4,800 orders; 4,800 × $7.2275 weighted realized price = $34,692 in monthly sales.
Across twelve modeled months, this produces $416,304 in 2026 revenue. No seat, staffing, or machine-capacity limit automatically reduces demand; test whether actual operations could deliver the planned order volume.
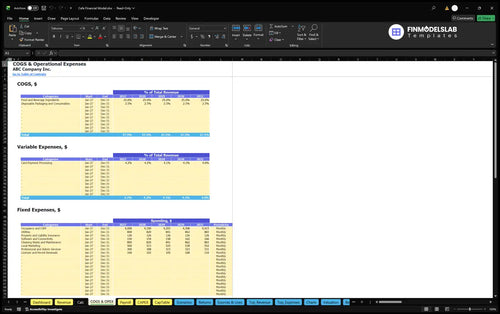
Cafe operating expenses are organized into direct ingredients and supplies, transaction-linked charges, monthly overhead, and separately scheduled base-pay payroll.
Direct costs use 25% of revenue for food and beverage ingredients plus 2.5% for disposable packaging and consumables. Payment processing is a separate variable expense, declining from 4.21% of revenue in 2026 to 4.03% in 2030.
Fixed costs include occupancy and CAM, utilities, insurance, software, maintenance, marketing, administration, and permits. Monthly occupancy and CAM increases from $4,000 in 2026 to approximately $4,415 in 2030.
The COGS and Operating Expenses report separates direct, variable, and fixed spending assumptions. Its effective dates, spending frequencies, and monthly calculations make it possible to trace how cafe sales and overhead affect projected operating margins.
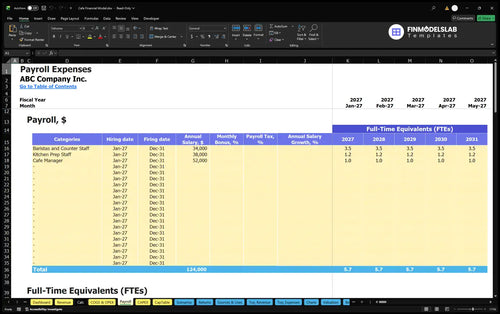
Payroll assumes 3.5 barista/counter-staff FTE at $34,000 per FTE, 1.2 kitchen-prep FTE at $38,000, and one manager at $52,000. Together these annual base salaries total $216,600; they are excluded from the other cost pools.
The Payroll Forecast plans staffing by role, full-time-equivalent levels, compensation, and timing. In this cafe case, the documented annual base-pay expense remains $216,600 through 2030; employer taxes and benefits are outside the illustrated EBITDA scope.
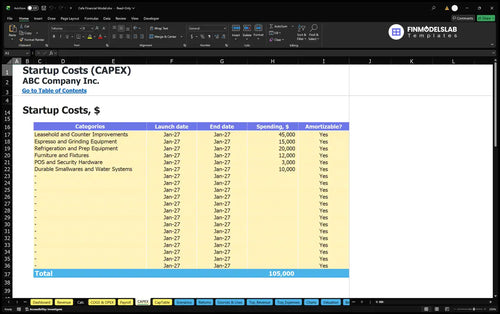
The opening budget distinguishes improvements and equipment from prelaunch cash needs, working capital, and the owner funds expected to finance the cafe.
Selected startup assets include $45,000 in leasehold and counter improvements, $15,000 in espresso and grinding equipment, $20,000 in refrigeration and prep equipment, and $12,000 in furniture and fixtures. Other assets include POS hardware and smallwares.
Separate opening cash includes the lease deposit, permits, preopening occupancy, training, and marketing. Working capital assumes zero receivable days, seven payable days, and fourteen inventory days.
The Capital Expenditure Plan records purchase dates, budgets, depreciable assets, and the resulting spending and depreciation schedules. This distinguishes fit-out and equipment investment from recurring cafe operating costs used to calculate EBITDA.
The illustrative opening-funding estimate is $241,674 in owner funds, with no confirmed non-owner funding. This combines startup assets, prelaunch cash, opening working capital, and a three-month cash operating expense reserve.
The Sources and Uses of Funds report traces cash sources, operating payments, investment, financing payments, and cash retained over a selected reporting period. It helps assess planned funding allocation; it does not by itself demonstrate that the cafe will always have sufficient cash.
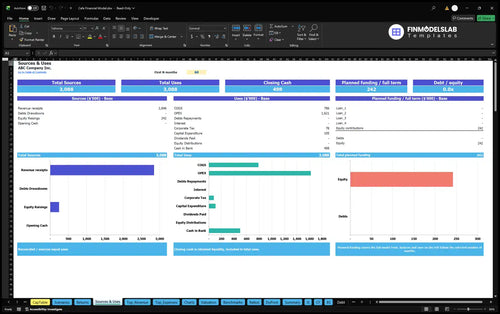
The supplied Base case shows growing annual sales and EBITDA, with operating costs reflecting the documented ingredients, processing, overhead, and base-pay assumptions.
| Year | Revenue | Operating Expenses | EBITDA |
|---|---|---|---|
| 2026 | $416,304 | $429,913 | -$13,609 |
| 2027 | $493,433 | $456,138 | $37,294 |
| 2028 | $574,046 | $483,453 | $90,593 |
| 2029 | $644,441 | $507,527 | $136,914 |
| 2030 | $717,939 | $532,579 | $185,360 |
Values are illustrative estimates rounded to whole dollars; small differences can result from displayed rounding.
The example moves from negative $13,609 EBITDA in 2026 to positive $185,360 in 2030 as daily orders and menu prices rise. These are earnings before interest, taxes, depreciation, and amortization—not net profit, a return on owner capital, or cash available for withdrawal.
The broader workbook includes income statement, balance sheet, and cash flow reporting. However, no numeric net-income, balance-sheet, or cash-flow projection is established by this source brief, so those outputs should be reviewed in the actual workbook after entering buyer-specific assumptions.
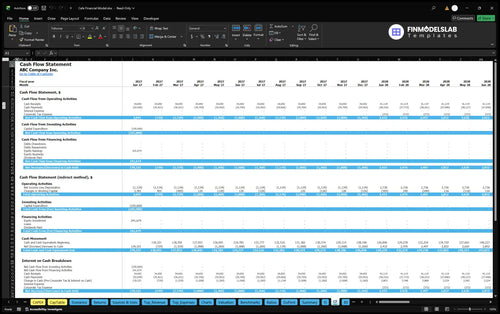
The Cash Flow Forecast reports operating, investing, and financing cash movements and reconciles opening to closing cash. This is where changes in inventory, payables, equipment purchases, equity funding, or debt terms can be assessed separately from EBITDA.
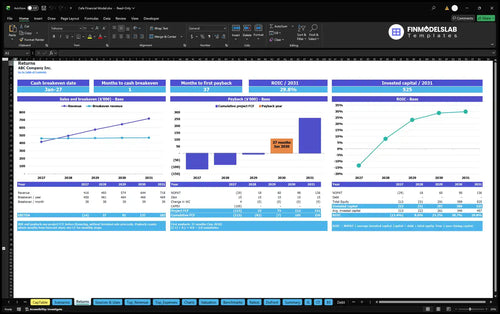
The Returns and scenario reports support several distinct questions: whether sales cover costs, when cash requirements are met, and how invested capital performs.
Sales break-even measures whether revenue covers operating costs; cash break-even addresses cash timing. Investment payback measures capital recovery, while annual ROIC evaluates returns on invested funds.
Dashboard Low, Base, and High scenarios adjust revenue and cost assumptions. Valuation and benchmark reports are included, but the supplied case establishes no payback date, ROIC, or valuation figure.
The Returns analysis presents sales break-even, cash break-even timing, investment payback, and return on invested capital as separate measures. Use the underlying cash-flow and invested-capital assumptions before interpreting a recovery period or investment return.
These answers clarify how the example forecast works and which decisions require additional review.
Monthly sales equal trading days times paid orders per day, allocated once across six receipt categories and multiplied by each category’s realized price.
Yes. Revenue inputs include annual paid orders per trading day, category shares, prices, and launch timing, which feed the monthly calculation schedule.
No. The illustrated sales engine is demand-based and has no automatic seat, machine, or staffing-capacity restriction.
No. The documented Base case includes fixed annual base pay but excludes employer burdens, benefits, and personal taxes.
No. Startup assets and preopening cash requirements are planned separately from annual operating expenses and EBITDA.
No. Investment payback, cash break-even, net profit, and EBITDA are different measures and require their respective supporting schedules.
No. The 2026–2030 figures are an illustrative US cafe planning scenario based on estimated inputs, not verified observed results or location-specific quotes.
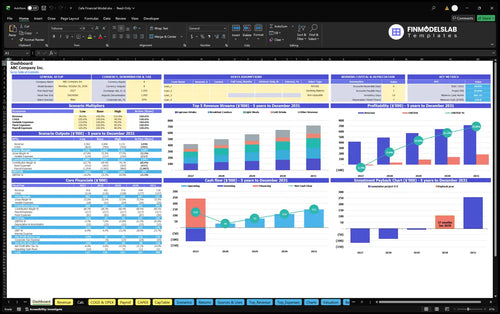
KPIs, forecasts, and cash flow at a glance.
Key assumptions and calculations driving revenue forecasts.
Funding sources, spending, and closing cash.
Cash break-even, payback, and ROIC.
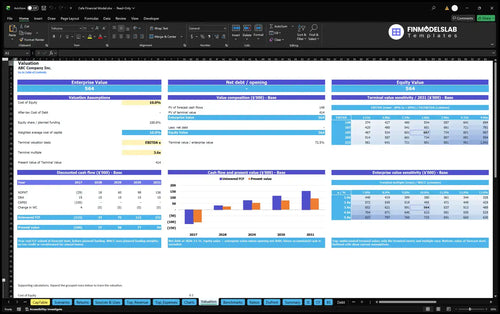
DCF valuation and sensitivity analysis.
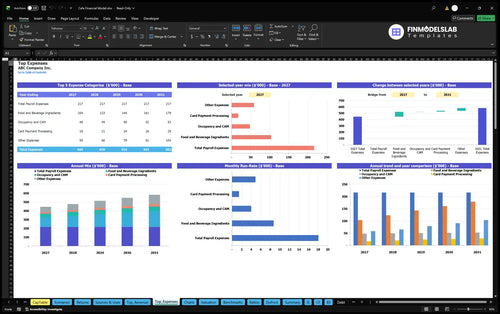
Largest costs and spending trends.
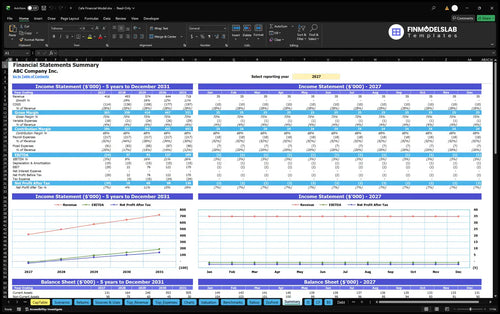
Annual and monthly financial performance.
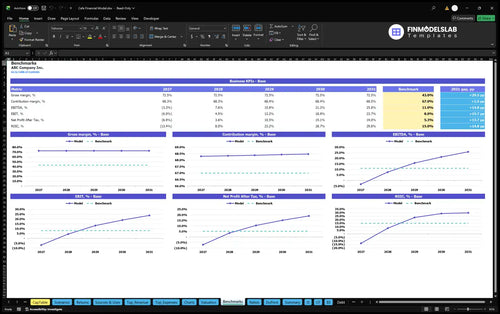
Compare margins and returns to benchmarks.

I’m not a spreadsheet expert, and this template kept the numbers understandable without making me fight the formulas. I saved about 6 hours on my first pass and could still explain the model to my partner.
Switching between low, base, and high cases used to be messy, but this made the setup straightforward. I had all three scenarios ready in one afternoon instead of spending a whole day sorting assumptions.
I wasn’t sure what investors wanted to see, and this template gave me a clean structure to follow. It helped me prepare a lender call with the right outputs in place and a much clearer story.