

Revenue and Calc
Adjust inquiry volume, conversion, vehicle mix, prices, and launch timing. Monthly calculations produce units and revenue by segment.


The Car Dealership Financial Model is an Excel template for a single-site US new-and-used vehicle retailer. It converts customer inquiries, sales conversion, six vehicle-category shares, and realized prices into monthly and annual revenue.
The illustrative dealership leases its showroom and lot, outsources preparation and warranty repairs, and earns no aftersales or finance-and-insurance income. The 2026–2030 example is a planning case, not an industry benchmark.
The template connects dealership-specific operating inputs with a wider set of financial statements, scenario controls, and management reports.
Adjust inquiry volume, conversion, vehicle mix, prices, and launch timing. Monthly calculations produce units and revenue by segment.
Plan inventory, preparation, warranty work, advertising, facilities, and staff separately without double-counting payments.
Set opening assets, capital spending, equity contributions, and optional debt terms, with linked financing schedules.
Review modeled earnings, cash, assets, liabilities, and funding in the Income Statement, Cash Flow, Balance Sheet, and Summary.
Select Low, Base, or High scenarios and use Checks to flag reconciliation or input problems.
Monthly vehicle sales equal qualified inquiries multiplied by the inquiry-to-sale conversion rate, then allocated once across six product categories.
The Base example begins with 400 qualified inquiries per month in 2026 and increases to 700 by 2030. A constant 12% conversion produces 48 to 84 vehicles sold monthly, or 576 to 1,008 vehicles annually.
The sales mix is 10% new sedans, 25% new SUVs, 15% new pickups, 15% used sedans, 25% used SUVs, and 10% used pickups. All shares use one vehicle-sales pool.
The Revenue Forecast connects qualified inquiries and sales conversion with category shares and realized vehicle prices. Its monthly calculations build each category’s revenue and reconcile the six offerings to total dealership sales.

400 inquiries per month × 12% conversion = 48 vehicles per month; 48 × $37,925 weighted vehicle price × 12 months = $21,844,800 annual revenue.
| Vehicle segment | Sales mix | Price per vehicle |
|---|---|---|
| New sedans | 10% | $34,500 |
| New SUVs | 25% | $47,000 |
| New pickups | 15% | $56,500 |
| Used sedans | 15% | $21,500 |
| Used SUVs | 25% | $29,500 |
| Used pickups | 10% | $36,500 |
Prices and mix are selected planning assumptions, not observed market averages.
Changing the number of inquiries tests traffic generation; changing conversion tests the retail sales process. Adjusting category shares or prices changes revenue per sold vehicle without double-counting transactions.
The dealership’s operating forecast separates vehicle-related direct costs, other variable spending, recurring overhead, and payroll.
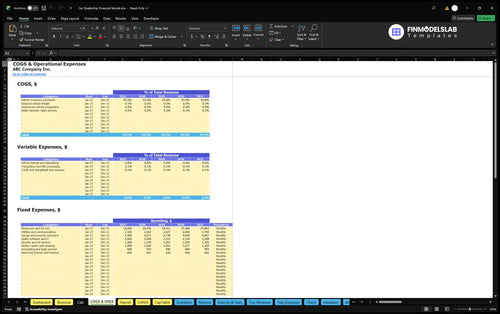
Direct costs total 94.5% of revenue: vehicle purchases at 93%, freight at 0.45%, outsourced preparation at 0.85%, and warranty claims at 0.2%. This leaves a narrow gross margin.
Variable operating costs total another 0.75% of revenue for listings and advertising, title and transaction processing, and credit losses. Fixed costs cover the leased lot, utilities, insurance, software, security, cleaning, professional services, and recurring licensing.
The COGS and Operating Expenses forecast distinguishes vehicle acquisition and preparation from variable selling costs and fixed overhead. Monthly expense schedules flow into the projected margins and operating expense totals.
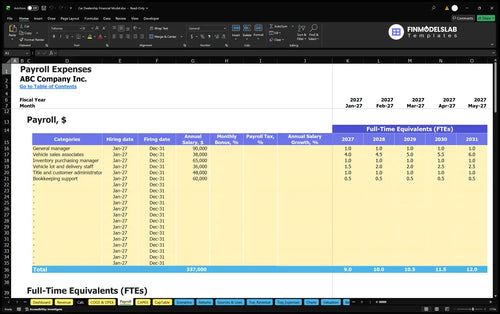
Payroll covers a general manager, vehicle sales associates, an inventory purchasing manager, lot and delivery staff, a title administrator, and bookkeeping support. Annual-average sales associate staffing rises from 4 to 6 FTE over the illustrative forecast.
The Payroll Forecast shows role-level staffing and pay assumptions, including FTE plans and salary costs. In the selected case, annual payroll rises from $439,000 in 2026 to $551,000 in 2030.
Startup assets, preopening cash spending, working-capital assumptions, and owner funding are tracked separately from the annual EBITDA forecast.
Initial asset assumptions include $225,000 in showroom and lot improvements, $35,000 in furniture and fixtures, $18,000 in computers, and $16,000 in security equipment, plus delivery and lot equipment. Other opening cash needs include deposits, permits, launch marketing, preopening pay, and prepaid insurance.
The Capital Expenditure Plan schedules dealership asset spending and depreciation where applicable. It helps separate investment in showroom facilities and equipment from recurring operating expenses.

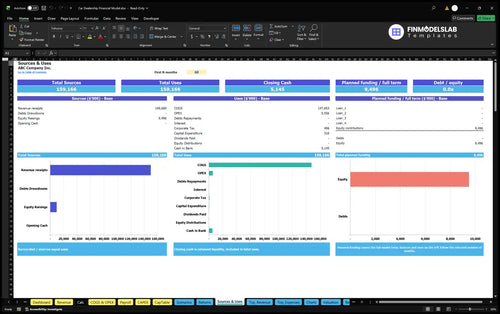
Estimated opening owner funding is $9,496,339, reflecting startup spending, launch working capital, and three months of operating cash outflows, with no confirmed external funding. Working-capital assumptions are 5 receivable, 0 payable, and 59 inventory days.
The Sources and Uses of Funds report groups modeled incoming equity or debt with operating, investing, and financing cash needs. Use it to examine planned funding allocation rather than treating opening owner contributions as sales or profit.
The 2026–2030 case projects increasing sales and positive EBITDA after operating expenses.
| Year | Revenue | Operating Expenses | EBITDA |
|---|---|---|---|
| 2026 | $21,844,800 | $21,614,572 | $230,228 |
| 2027 | $25,940,700 | $25,562,127 | $378,573 |
| 2028 | $30,036,600 | $29,491,912 | $544,688 |
| 2029 | $34,132,500 | $33,439,933 | $692,567 |
| 2030 | $38,228,400 | $37,370,196 | $858,204 |
Operating expenses include direct costs, variable expenses, fixed overhead, and payroll; displayed values are rounded to whole dollars.
In 2026, the case generates $21,844,800 of sales and $230,228 of EBITDA, compared with $38,228,400 of sales and $858,204 of EBITDA by 2030. These are illustrative outputs from the selected inputs, not measured dealership results.
EBITDA measures operating performance before depreciation, interest, taxes, and amortization. It is not net profit, cash generated, or evidence that the modeled opening investment will be recovered.
Cash timing also matters because vehicle inventory can tie up substantial funds even when an income statement reports a positive operating margin. Receivable, payable, inventory, capital spending, and financing assumptions affect modeled liquidity.
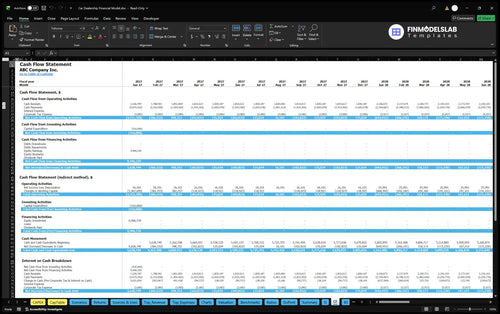
The Cash Flow Forecast separates operating receipts and payments from investment and financing activity. Review monthly cash balances and the opening-to-closing reconciliation before assessing the dealership’s possible funding needs.
Returns and scenario reporting support distinct questions about operating coverage, investment recovery, capital efficiency, and assumption risk.
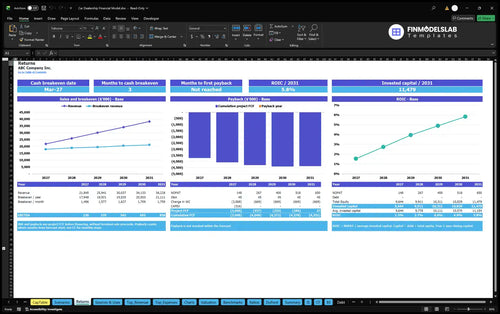
Sales break-even examines how much revenue is needed to cover the modeled cost structure. Cash break-even asks when cash inflows cover relevant cash outflows; investment payback follows cumulative project cash flows; annual ROIC compares operating returns with invested capital.
The Break-Even, Payback and ROIC report brings together sales coverage, cash break-even timing, cumulative investment cash flows, and annual return on invested capital. No particular break-even date, payback period, or ROIC value is established by this example.
Use the Dashboard’s Low, Base, and High scenario multipliers to test changes in revenue and the four operating cost categories. Vehicle conversion, realized selling prices, and purchase costs deserve special attention because they materially influence a dealership’s operating margin.
Use this template to plan vehicle-only retail operations and explain forecast assumptions.
Linked inputs help owners and advisors test conversion, vehicle mix, supplier cost, staffing, rent, and inventory funding. Monthly schedules reveal timing issues hidden in annual EBITDA.
Valuation, ratios, benchmarks, and charts support additional analysis, but the source case establishes no valuation, lender approval, tested liquidity sufficiency, or investor returns.
These answers clarify what the spreadsheet models, which assumptions are editable, and how to interpret the reports.
Yes. It allocates one vehicle-sales pool across new sedans, SUVs, pickups, and the same three used-vehicle categories.
Monthly units equal qualified vehicle inquiries multiplied by the inquiry-to-sale conversion rate; category shares then allocate units to realized selling prices.
No. The illustrated operation excludes paid aftersales and finance-and-insurance product income, and it outsources preparation and warranty repairs.
Yes. The Payroll and COGS & OPEX worksheets contain role-level staffing and separate direct, variable, and fixed expense assumptions.
No. It is a case-specific owner funding estimate derived from selected startup, working-capital, and cash-reserve assumptions, not a universal dealership funding requirement.
No. EBITDA excludes important cash effects from inventory, capital spending, financing, and other timing differences; consult Cash Flow and the Balance Sheet.
The Returns worksheet supports sales break-even, cash break-even, payback, and annual ROIC analysis, but the supplied case establishes no specific results for those measures.
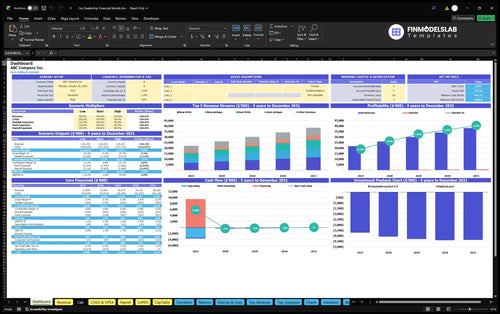
KPIs, forecasts, and cash flow at a glance.
Key assumptions and calculations driving revenue forecasts.
Funding sources, spending, and closing cash.
Cash break-even, payback, and ROIC.
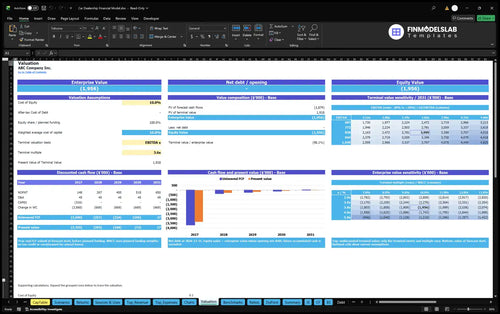
DCF valuation and sensitivity analysis.
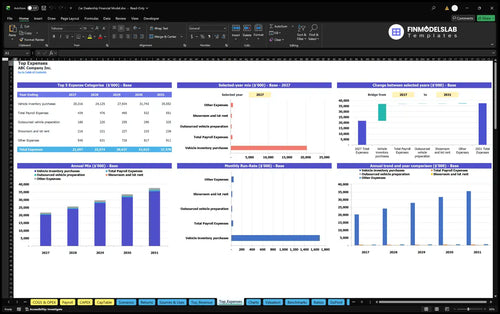
Largest costs and spending trends.
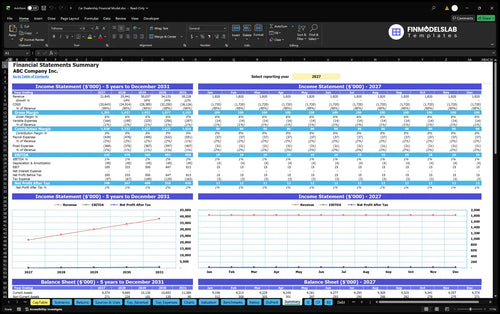
Annual and monthly financial performance.
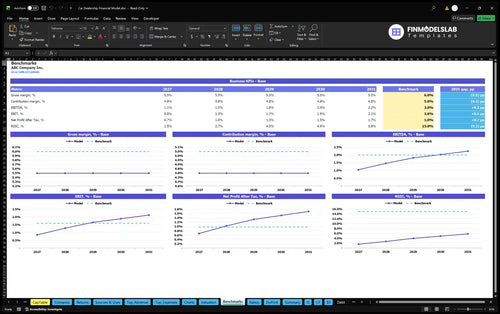
Compare margins and returns to benchmarks.

I didn’t have to build anything from scratch, so I got the dealership model moving the same day and saved about 6 hours of setup time.

The pricing, service costs, and growth inputs were all laid out clearly, which made my numbers easier to sort out and share. I cut my assumption prep by nearly half a day.
It made the margin picture and break-even point much easier to read, so I could spot weak spots before presenting the plan. That saved me a round of back-and-forth with our lender.