

Revenue and Calc
Set lounge capacity, sessions, operating days, utilization, five package prices, and booking mix. Monthly calculations allocate sold guest places among packages without duplicating capacity.


The Cat Cafe Financial Model is an Excel financial planning template for an independent U.S. cat cafe. It forecasts visitor-package sales from available lounge places, booked sessions, utilization, package mix, and prices, then connects those revenues to operating costs, staffing, and financial reports.
The included illustrative case models a 1,800-square-foot cafe with a separate beverage and snack area, a cat lounge, approximately twelve resident cats, and sixteen guest places per session. The forecast covers 2026 through 2030, with a January 31, 2026 launch date.
The workbook links cat lounge operating assumptions to monthly calculations, annual forecasts, and financial planning reports.
Set lounge capacity, sessions, operating days, utilization, five package prices, and booking mix. Monthly calculations allocate sold guest places among packages without duplicating capacity.
Budget ingredients, purchased snacks, payment fees, local marketing, animal care, occupancy costs, and dedicated cafe and cat lounge staffing.
Plan cafe improvements and equipment, record owner contributions, and configure financing facilities and repayments if funding assumptions change.
Review the income statement, cash flow, balance sheet, combined summary, revenue mix, expense trends, and management indicators supported by the workbook.
Compare Low, Base, and High settings; inspect break-even, payback, ROIC, and valuation functions; and use checks to review model consistency.
Revenue is calculated from one shared guest-place capacity pool and the price of each visitor package, not from separate overlapping cafe and lounge demand forecasts.
The case has 16 guest places × 8 sessions × 26 open days, or 3,328 available places in a typical operating month. Sold-place utilization is 32% in 2026, rising to 52% in 2030; the monthly launch flag determines when sales begin.
Every sold visit belongs to one package: Cat Lounge Visit (20%), Coffee and Cat Visit (35%), Coffee Snack and Cat Visit (25%), Premium Cafe and Cat Visit (10%), or Group Cafe and Cat Visit (10%). Package shares total 100%.
The Revenue Forecast connects guest places, bookable sessions, utilization, package shares, and unit prices to projected sales. Its operating assumptions feed monthly calculations before the annual revenue totals are reported.
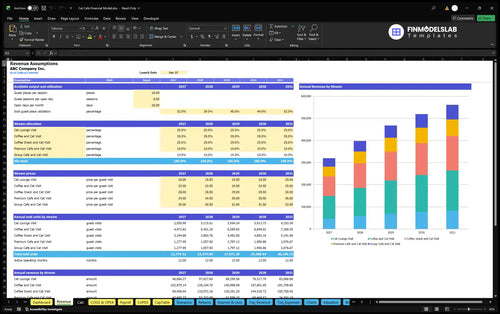
16 × 8 × 26 × 12 × 32% = 12,779.52 sold visits; 12,779.52 × $25.05 weighted package price ≈ $320,127 annual revenue.
For 2026, prices range from $18 for the lounge-only package to $34 for the premium package. Annual price increases and higher utilization jointly lift projected revenue; actual demand is not independently capped in this capacity-based example.
The model does not add separate walk-in cafe sales, adoption fees, donations, or alcohol receipts. Beverage and snack value is already incorporated into the relevant combined visitor packages.
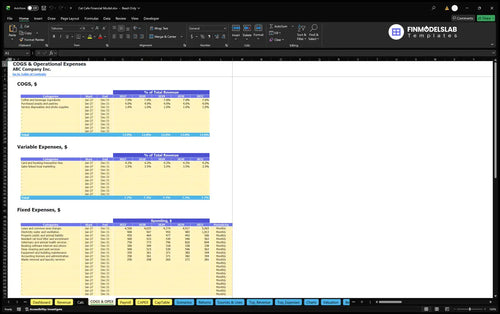
The model separates revenue-linked direct and variable costs from monthly fixed expenses and salaries, avoiding double counting between expense categories.
Direct costs total 12% of revenue: coffee and beverage ingredients (7%), purchased snacks and pastries (4%), and service disposables and photo supplies (1%). Variable operating expenses add 4.2% for card and booking transactions and 3.5% for sales-linked local marketing.
Fixed expenses include rent, utilities, insurance, resident cat food and litter, veterinary services, cleaning, booking software, maintenance, accounting, and waste removal. The estimated 2026 lease and common-area input is $4,500 per paid month.
The COGS and Operating Expenses report organizes direct costs, revenue-related charges, and recurring fixed expenses. It helps show how ingredient costs, booking fees, animal care, and occupancy spending affect operating margins.
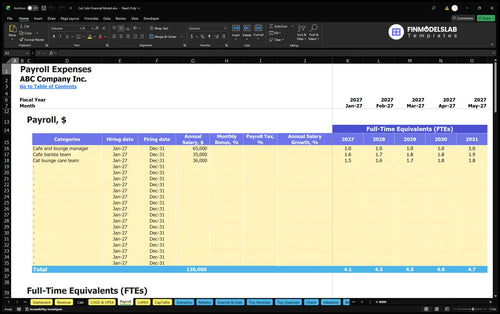
Payroll is budgeted independently from visitor volumes. In 2026, the planning case includes one cafe and lounge manager at $65,000, 1.6 barista FTE at $35,000 per FTE, and 1.5 cat-care FTE at $36,000 per FTE.
The Payroll Forecast plans compensation by role, employment dates, salaries, and annual-average FTE. In the example, annual base payroll rises from $175,000 in 2026 to $196,300 in 2030 as staffing coverage changes.
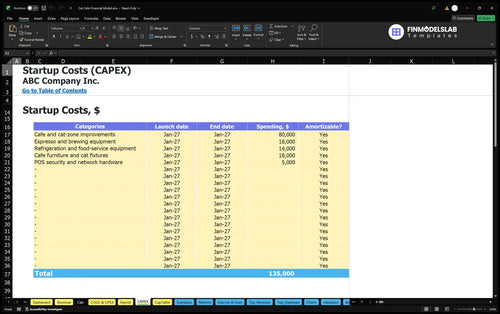
Startup investments and preopening payments are separate from operating expenses and do not represent annual EBITDA.
The illustrative opening asset plan includes $80,000 of cafe and cat-zone improvements, $18,000 of espresso and brewing equipment, $14,000 of refrigeration and food-service equipment, and $18,000 of furniture and cat fixtures. POS, security, and network hardware are additional assets.
Separate prelaunch cash needs cover deposits, advance rent, permits and professional fees, staff training, launch marketing, and initial animal-health supplies. The opening funding estimate also considers initial inventory and a three-month recurring cash reserve.
The Capital Expenditure Plan schedules purchases of improvements, cafe equipment, and fixtures, then tracks applicable depreciation. Those investment entries are separate from recurring operating expenses and from initial opening cash payments.
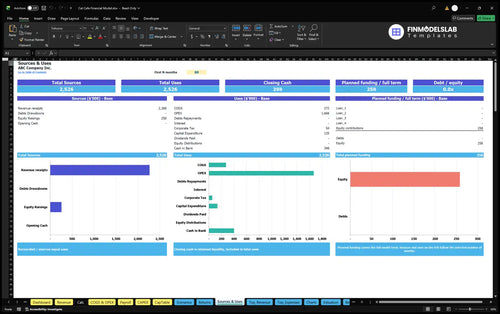
Initial owner funding is estimated at $258,119, with no external financing committed in the case. Working-capital controls use zero accounts-receivable days, eight accounts-payable days, and ten inventory days; adjusting them can change the timing of cash needs.
The Sources and Uses of Funds report organizes equity and optional debt inflows against operating, investment, and financing cash allocations. It supports funding discussions without treating the illustrative owner contribution as guaranteed cash sufficiency.
The selected planning case shows revenue rising as booked-place utilization and package prices increase, while staffing and operating expenses are budgeted separately.
| Year | Revenue | Operating Expenses | EBITDA |
|---|---|---|---|
| 2026 | $320,127 | $344,265 | -$24,138 |
| 2027 | $397,942 | $369,881 | $28,062 |
| 2028 | $468,150 | $394,093 | $74,057 |
| 2029 | $519,547 | $411,198 | $108,349 |
| 2030 | $561,740 | $426,492 | $135,248 |
Rounded illustrative projections, not actual results. Display rounding can create small one-dollar differences; expenses include direct, variable, fixed, and base payroll costs.
In this illustrative planning case, EBITDA changes from a $24,138 operating loss in 2026 to $135,248 of positive EBITDA in 2030. EBITDA is before depreciation, financing charges, and income taxes, so these figures cannot be read as net profit.
The workbook also includes projected income statement, balance sheet, and cash flow functions. Those reports can be used to investigate the consequences of assumptions, but no additional statement totals or tested cash runway are claimed for this example.
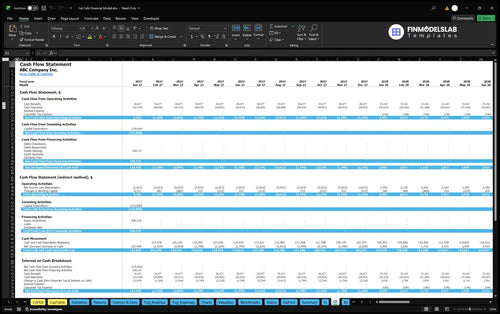
The Cash Flow Forecast separates operating, investing, and financing movements and reconciles opening and closing cash. It is the relevant report for assessing liquidity effects of inventory timing, asset purchases, owner funding, and any configured borrowing.
The workbook provides decision tools for testing visitor utilization, package pricing, costs, financing assumptions, and investment returns.
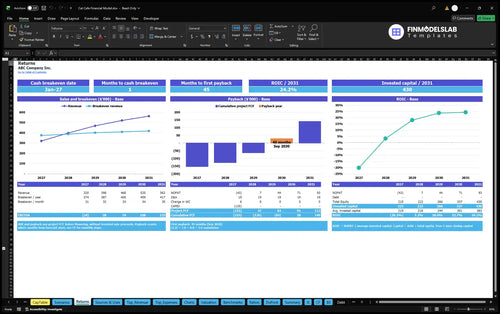
Sales break-even compares operating revenue with the cost structure needed to cover expenses. Cash break-even considers when cash receipts and payments balance; investment payback tracks recovery of invested capital; annual ROIC measures return relative to invested capital.
These measures answer different questions and cannot be calculated from the displayed EBITDA figures alone. The illustration supplies no verified payback month, ROIC percentage, valuation result, or investor IRR.
The Returns analysis distinguishes sales break-even, cash break-even, investment payback, and annual ROIC. Buyers can use these functions to investigate operating thresholds and investment recovery after entering their own costs and funding assumptions.
Dashboard scenario controls apply Low, Base, and High multipliers to revenue, COGS, variable expenses, fixed expenses, and payroll. Scenario comparisons help examine whether lower lounge occupancy, changes in package economics, or higher animal-care spending alter operating resilience.
Separate valuation, benchmark, ratio, and DuPont reports provide additional analytical functions. Their outputs depend on the workbook inputs and should not be mistaken for independently verified cat cafe industry benchmarks.
Use the template to translate a proposed cat cafe concept into testable operating, investment, and financing assumptions.
It fits preopening planning, package-mix decisions, lease and space evaluations, staff coverage budgeting, and discussions with prospective funders. Buyers can replace the estimated values with their own location, lounge capacity, booking schedule, pricing, cat-care costs, and investment plan.
The reference case assumes a secondary U.S. metropolitan neighborhood and an unsigned lease. Its numbers are estimates for modeling purposes, not observed industry averages, a site feasibility opinion, or a promise of profitability.
Answers to common questions about the assumptions, operating forecast, and workbook reports.
Yes. Update places per session, daily sessions, days open, launch date, and utilization in the revenue assumptions.
Yes. It allocates one pool of sold guest visits across five mutually exclusive packages using editable shares and prices.
No. Beverage and snack value is included in visitor packages; standalone cafe, adoption, donation, and alcohol sales are outside this case.
Yes. Payroll plans role-level FTE and compensation; fixed expense inputs separately cover resident cat food, litter, veterinary care, and related services.
No. EBITDA excludes depreciation, financing costs, and income taxes. The cited case outputs stop at EBITDA.
Yes. Its declared reports include cash flow, balance sheet, Sources & Uses, and financing schedules; individual results depend on the entered assumptions.
No. Returns tools evaluate break-even, payback, and ROIC, but the illustrative inputs do not establish a verified payback period.
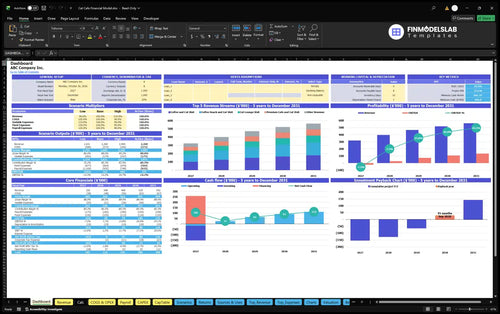
KPIs, forecasts, and cash flow at a glance.
Key assumptions and calculations driving revenue forecasts.
Funding sources, spending, and closing cash.
Cash break-even, payback, and ROIC.
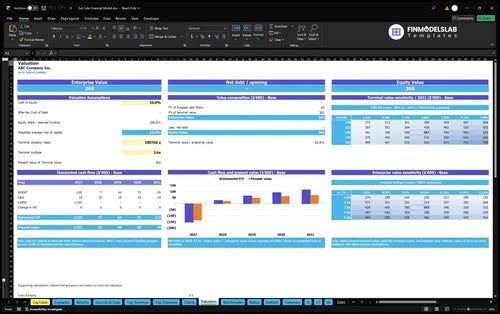
DCF valuation and sensitivity analysis.
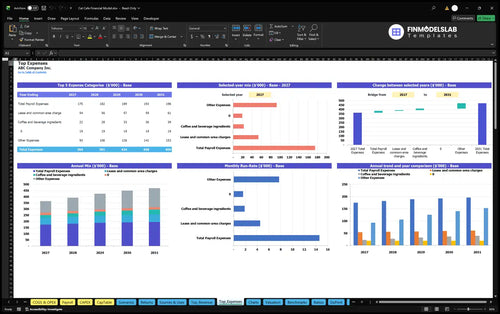
Largest costs and spending trends.
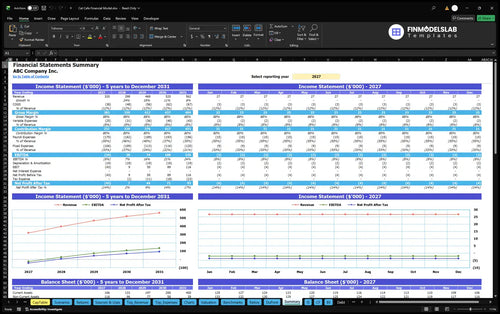
Annual and monthly financial performance.
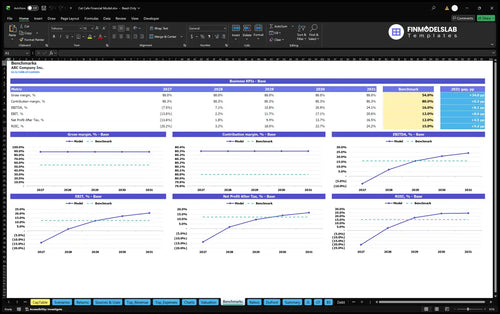
Compare margins and returns to benchmarks.

This template made runway and shortfall planning much easier to follow. I could map cash needs for the next 12 months in one afternoon and book a lender meeting with numbers I actually understood.
I used to dread building low, base, and high cases by hand. With this model, I updated all three in under an hour and had a cleaner planning discussion with my partner.
I’m not strong in Excel, so most models feel hard to touch. This one kept the inputs clear and saved me a few hours of guesswork when I was setting up our first forecast.