

Revenue and Calc
Set opportunity demand, completion, seasonality, channel mix, and realized amounts; inspect monthly and annual revenue.


The Nonprofit Organization Financial Model is an Excel planning template for a US education and basic-needs charity. It connects opportunities, completed engagements, five funding channels, staffing, and operating costs to monthly forecasts and financial reports.
The 2026–2030 example assumes a leased office and 501(c)(3) public charity. The documented case ends at EBITDA; cash flow, returns, and balance sheet values require separate analyses.
The workbook links editable nonprofit operating assumptions to monthly calculations, standard financial statements, and management reports.
Set opportunity demand, completion, seasonality, channel mix, and realized amounts; inspect monthly and annual revenue.
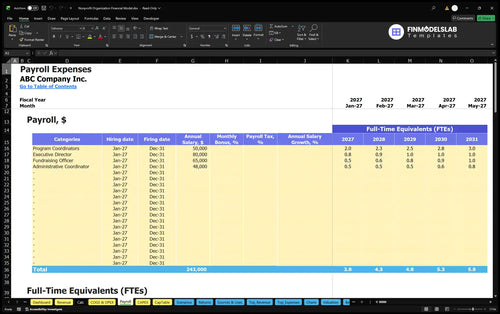
Plan supplies, participant aid, instructors, fundraising, overhead, role-level FTE, and base salaries without double-counting contractors.
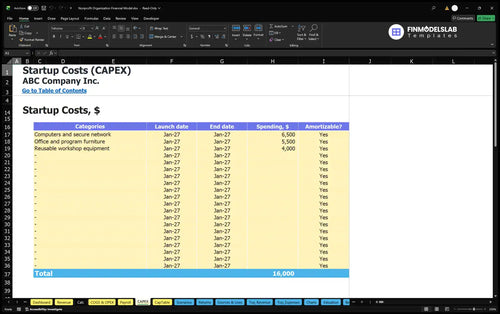
Enter startup assets, prelaunch cash needs, funding contributions, working-capital days, and optional debt assumptions.
Review Income Statement, Cash Flow, Balance Sheet, Dashboard, and combined Summary reports.
Compare Low, Base, and High cases, reconciliations, break-even, payback, and ratios.
One demand-based opportunity pool is completed and allocated once across five nonprofit funding and program streams.
Monthly completed engagements equal qualified opportunities multiplied by the completed funding or program rate and the monthly seasonal factor. Qualified opportunities rise from 1,000 per month in 2026 to 1,600 in 2030; the selected completion assumption is 12%.
The five allocated shares are individual donations 60%, major gifts 15%, foundation grants 2%, corporate sponsorships 3%, and program fees 20%. Each share uses its own annual realized amount per engagement, without adding another volume engine or a donor-cohort roll-forward.
The Revenue Forecast connects opportunity volume, seasonal timing, completion, funding-channel mix, and realized contribution or fee amounts to each revenue stream. Calc then produces the monthly totals feeding the financial statements.
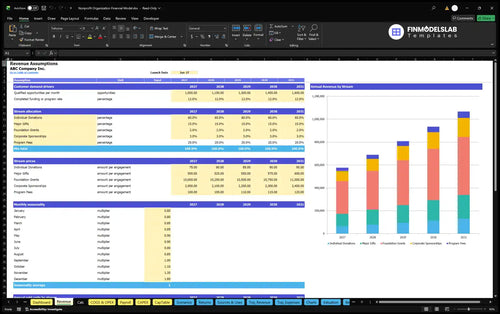
1,000 opportunities × 12% completed × 60% individual-donation mix × $75 per engagement = $5,400 modeled donations.
The 2026 seasonal multipliers range from 0.8 to 1.8, with stronger modeled activity in December. Contributions begin in the January 2026 launch month; the template assigns zero revenue to months before launch. All selected channel prices and completion assumptions are estimates, not validated donor behavior.
The model separates delivery costs, fundraising-related variable spending, monthly overhead, and paid administrative and program roles.
Program materials and supplies are 10% of revenue, participant aid and mini-grants 25%, and contracted program instructors 8%. Together, these direct costs total 43% of modeled revenue; fundraising campaigns and events add 4%, and payment processing another 1% as variable operating expenses.
The COGS and Operating Expenses forecast separates direct mission delivery, fundraising and processing costs, and fixed office overhead. Its monthly assumptions flow into gross margin, contribution margin, and operating earnings.
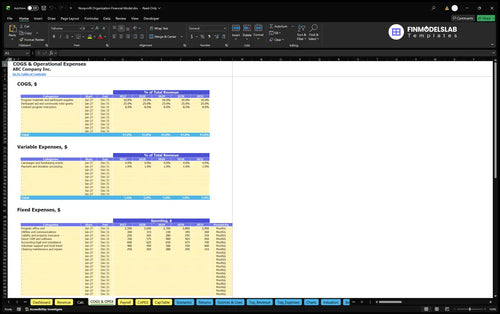
Fixed expenses cover rent, utilities, insurance, donor CRM, professional compliance, volunteer support, travel, cleaning, and maintenance. Rent is budgeted at $2,500 per month in 2026 and $2,900 in 2030, each for 12 paid months; total fixed expenses are modeled separately from salaries.
The Payroll Forecast plans Program Coordinators, the Executive Director, Fundraising Officer, and Administrative Coordinator by annual-average FTE and annual base pay. Total planned payroll increases from $216,500 in 2026 to $331,000 in 2030.
Opening asset purchases, prelaunch cash requirements, and founder seed contributions are entered separately from annual operating expenses.
The startup asset plan includes $6,500 for computers and network equipment, $5,500 for furniture, and $4,000 for reusable workshop equipment: $16,000 of listed assets. Additional preopening items cover formation, website and donor setup, outreach, a refundable deposit, and setup pay, without specified amounts in this brief.
The Capital Expenditure Plan schedules equipment and furniture purchases, flags depreciable items, and calculates book-value and depreciation schedules. These capital items are distinct from the operating expenses summarized through EBITDA.
The opening founder contribution is estimated at $209,487, with no nonprofit equity ownership or distribution right. Accounts receivable, payable, and inventory-day settings are 25, 3, and 3 days; the inventory control does not imply a retail inventory business.
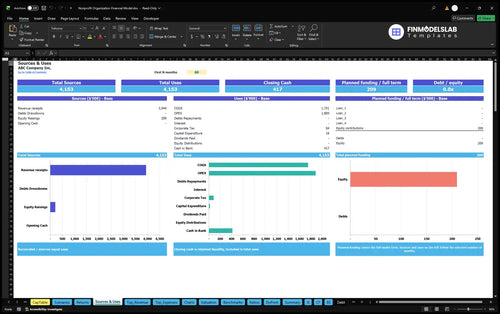
The Sources and Uses of Funds report compares planned cash sources with operating, investment, and financing uses over a selected period. It helps distinguish donated startup capital from nonprofit revenue and cash retained for future activity.
The selected 2026–2030 example projects rising nonprofit revenue and positive EBITDA after the documented operating cost categories.
| Year | Revenue | Operating Expenses | EBITDA |
|---|---|---|---|
| 2026 | $576,000 | $548,780 | $27,220 |
| 2027 | $688,482 | $636,336 | $52,146 |
| 2028 | $807,768 | $727,159 | $80,609 |
| 2029 | $933,858 | $817,247 | $116,611 |
| 2030 | $1,066,752 | $910,601 | $156,151 |
Illustrative assumptions, not actual results; whole-dollar rounding may affect displayed differences.
Revenue grows as assumed monthly opportunities increase and per-engagement funding amounts rise over the forecast. The illustrated 2026 EBITDA of $27,220 equals $576,000 of revenue less $548,780 of direct costs, variable expenses, fixed expenses, and payroll.
By 2030, the case shows $156,151 of EBITDA after $910,601 in rounded operating expenses. EBITDA is not cash flow, unrestricted funding, or net profit; depreciation, financing costs, and other statement components must be assessed separately.
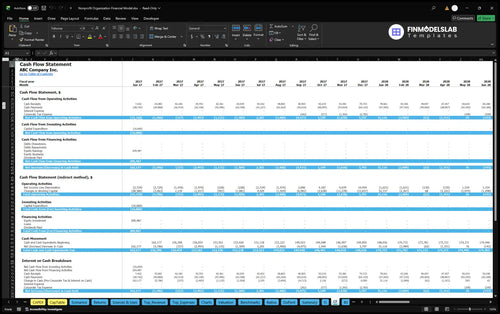
The Cash Flow Forecast tracks operating, investing, and financing cash movements alongside opening and closing balances. Use it to assess timing effects from receipts, payments, capital purchases, and funding; the EBITDA example alone does not establish adequate cash.
The standard reports support scenario comparisons, operating break-even, cash break-even, investment payback, and annual return measures as different calculations.
Dashboard Scenario Controls vary revenue, direct costs, variable expenses, fixed expenses, and payroll across Low, Base, and High cases. The Scenarios report compares revenue and margins to show sensitivity to fundraising completion or delivery-cost assumptions; no tested alternative case values are provided here.
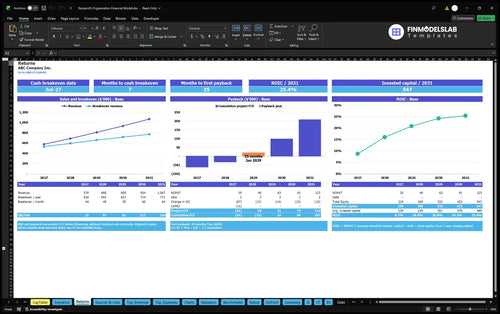
The Returns report distinguishes sales break-even from cash break-even, cumulative investment payback, and annual return on invested capital. For a charity, these figures are planning indicators, not shareholder distributions or an implied investor return.
The funding controls can also model debt facilities and repayment schedules if borrowing is entered. No borrowing terms, payback month, ROIC, valuation, or confirmed cash adequacy is established by the supplied case.
It is designed for planning a small US community education and basic-needs charity with donations, sponsorships, grants, and program fees.
The case excludes hospitals, tuition-based schools, retail, memberships, endowments, and federal award administration. It does not establish tax-exempt status, charitable fundraising compliance, or grant award probabilities.
Funding rates, costs, and staffing are estimates, not industry averages. Verify assumptions against organizational records and interpret equity-style reports cautiously because surpluses are retained for mission activities.
These answers distinguish the editable workbook features from the limits of the illustrative nonprofit case.
Yes. Edit qualified opportunities, completion, channel shares, seasonality, and realized amounts.
No. Revenue uses one opportunity pool, not donor cohorts or retention roll-forwards.
No. Grant revenue is an estimate based on the 2% modeled channel share and the selected amount per completed engagement.
No. The assumed public charity retains surpluses for mission activity, and the founder contribution confers no equity interest.
No. This illustrative operating case excludes employer taxes, employee benefits, and personal taxes, although the standard workbook provides payroll settings.
Yes. Cash Flow and Balance Sheet reports are included, but the documented case ends at EBITDA.
Yes. Returns functions cover sales break-even, cash break-even, payback, and annual ROIC, but this example provides no verified results for them.
No. The scope excludes federal award administration, endowment activities, school tuition, and membership dues.
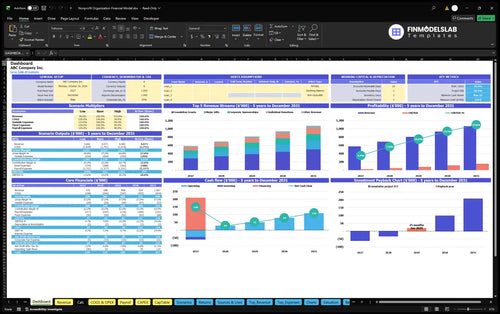
KPIs, forecasts, and cash flow at a glance.
Key assumptions and calculations driving revenue forecasts.
Funding sources, spending, and closing cash.
Cash break-even, payback, and ROIC.
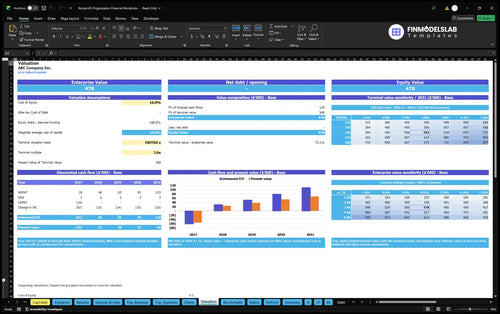
DCF valuation and sensitivity analysis.
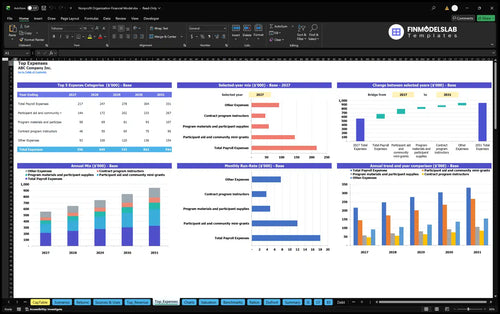
Largest costs and spending trends.
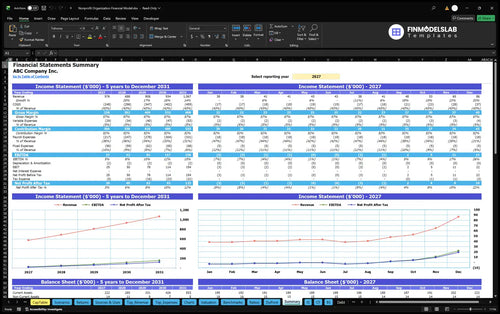
Annual and monthly financial performance.
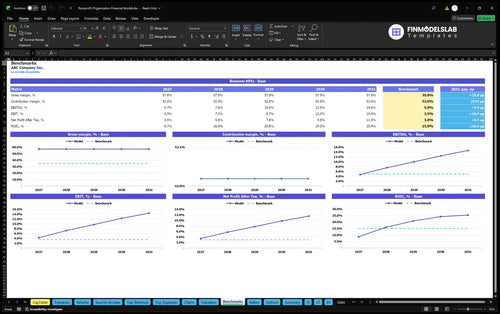
Compare margins and returns to benchmarks.

It pulled our statements and charts out of scattered files and into one view, which saved our team about 6 hours each month. Board prep got a lot easier too.

We finally had a clear starting point instead of trying to build the model from scratch. It cut our setup time by two days and made the assumptions much easier to explain.
The cash-flow view made our runway and shortfalls much easier to follow. We caught a funding gap earlier, which helped us plan the next meeting with our board in time.