

Allocate Land
Allocate cultivated area to each crop using its land-allocation percentage.


It is an editable 10-year workbook that turns land allocation, crop yield, harvest timing, losses, and prices into financial projections and reports.
Use the workbook to plan crop mix, harvest schedules, saleable yield, pricing, costs, staffing, capital needs, and financing while reviewing how those assumptions affect projected performance.
Business-specific inputs feed linked calculations, monthly schedules, financial statements, scenarios, and management views so changes flow through the model.
Revenue is built from cultivated land, crop allocation, yield per harvest, harvest frequency, yield loss, selling price, and any stated sales-cycle lag.
Allocate cultivated area to each crop using its land-allocation percentage.
Count marked harvest months to determine each crop’s harvests per year.
Multiply allocated area by yield per area per harvest and annual harvest count.
Apply yield loss, then shift recognition by the stated sales-cycle lag when used.
Multiply net saleable yield by selling price and sum revenue across crop categories.
The Revenue Assumptions view connects cultivated land, crop allocation, yield, harvest months, yield loss, sales-cycle timing, and selling prices to projected crop revenue.
 REVENUE ASSUMPTIONS
The COGS & OPEX view separates direct crop costs, revenue-linked variable expenses, and fixed operating expenses across the forecast.
 COGS & OPEX
Scenario Analysis compares Low, Base, and High cases for revenue, gross margin, contribution margin, and EBITDA across the 10-year forecast.
 SCENARIO ANALYSIS
The Dashboard combines model setup, scenario controls, operating metrics, financial trends, cash flow, and investment views in one management screen.
 DASHBOARD
It fits citrus operations using land allocation, crop yield, harvest timing, losses, selling prices, and linked operating schedules; different logic may require customization.
The template is a planning starting point, not a guarantee of performance.
Financial Models Lab can build or adapt a model when your requirements need different revenue logic, operating schedules, calculations, or reporting.
ORDER A CUSTOM FINANCIAL MODELAfter checkout, you receive the editable Citrus Farming Financial Model as an instant download for use in Excel or Google Sheets.
Update business assumptions, operating drivers, costs, staffing, financing, and other editable inputs.
Review the model across a 10-year horizon with monthly operating detail and annual views.
Compare Low, Base, and High cases using the workbook’s scenario analysis.
Review the Income Statement, Cash Flow, Balance Sheet, Summary, Dashboard, and additional model reports.
The essential answers are visible in full, with no accordion clicks required.
It allocates cultivated land by crop, applies yield and harvest frequency, reduces output for yield loss, and multiplies saleable yield by selling price. When a sales-cycle lag is used, proceeds are recognized after the stated months without changing physical yield.
You can edit the operating start date, units, total cultivated area, crop allocation, yield per area per harvest, harvest months, yield-loss rate, sales-cycle lag when used, and selling prices by crop and year.
You can compare Low, Base, and High cases across revenue, gross margin, contribution margin, and EBITDA over the forecast.
The workbook includes the Income Statement, Cash Flow Statement, Balance Sheet, Dashboard, Summary, Scenario Analysis, Valuation, Break-Even, ROIC, Charts, and KPIs.
Yes. Financial Models Lab can build or adapt a model when you need different revenue logic, operating schedules, calculations, or reporting.
It is a forecast based on the assumptions entered into the workbook, not a guarantee of business performance.
You don't need to be a finance expert to use this model. With a clear layout and intuitive design, it's built for founders and farm managers, not just CFOs. The framework guides you through the process, making it simple to create a powerful financial plan for your horticulture business plan without getting lost in complex formulas.
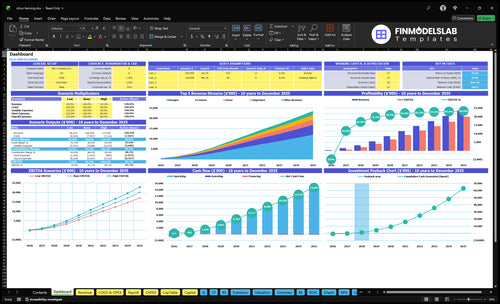
Core inputs and core outputs
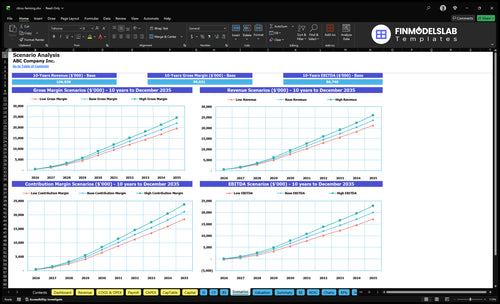
Three scenario analysis
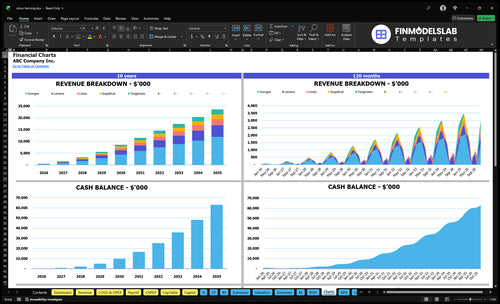
Presentation ready
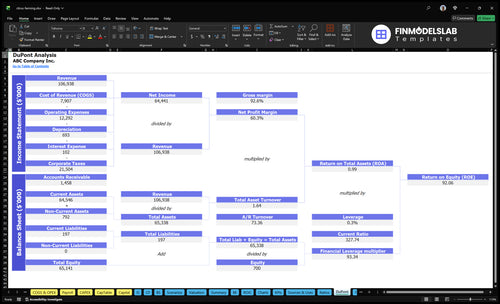
DuPont analysis
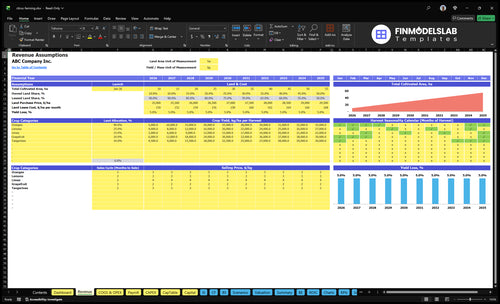
Researched revenue assumptions
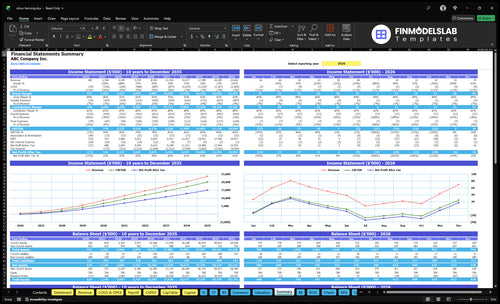
Lender-friendly financial outputs
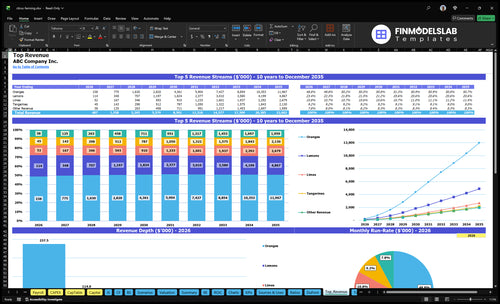
Revenue stream detailed view
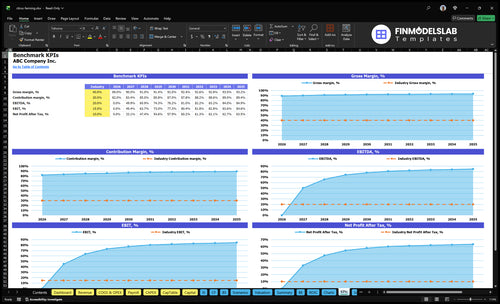
Performance metrics benchmark

This model made cash-flow gaps easy to spot, so I could see shortfalls months ahead and plan funding on time. It saved me hours of guessing and gave our next lender call a much cleaner story.

I finally had a simple way to see margins and break-even by season, which helped me tighten pricing and costs fast. It cut a full afternoon of spreadsheet work into one review.
All the statements and charts were in one place, so I stopped chasing files before board updates. I built a cleaner monthly pack in under an hour and booked the meeting with confidence.