

Revenue and Calc
Edit bearing acres, cherry output, recovery, annual crop realization, monthly seasonality, grade allocation, and green-bean prices. Monthly calculations consolidate all five grade sales.


The Coffee Farming Financial Model is an Excel template for planning production, specialty green-bean sales, operating expenses, staffing, and financing for a coffee orchard. It converts agricultural capacity and seasonal harvest assumptions into monthly calculations and 2026–2030 financial projections.
The illustrated case is a hypothetical 20-acre leased mature Arabica orchard in Kona, Hawaii, with on-site wet processing, drying, hulling, and sorting. It sells five distinct green-bean grades to roasters; it does not model roasting, retail coffee sales, tours, or purchased-bean resale.
Linked input schedules, monthly calculations, financial statements, and review reports support the illustrated coffee-farming operation.
Edit bearing acres, cherry output, recovery, annual crop realization, monthly seasonality, grade allocation, and green-bean prices. Monthly calculations consolidate all five grade sales.
Set revenue-based direct and selling costs, monthly farm overhead, annual-average staffing FTE, and salaries. Payroll remains separate from other expense categories.
Plan tractors, processing equipment, site improvements, equity contributions, and optional loan facilities. These are separate from operating expenses.
Review the Income Statement, Cash Flow, Balance Sheet, Dashboard, Scenarios, Returns, Valuation, Sources & Uses, and Checks. Case results are documented through EBITDA only.
The revenue forecast starts with mature bearing acreage and cherry output, then converts cherries to saleable green pounds and assigns every pound to one grade.
The case uses 20 bearing acres, a peak ceiling of 1,800 cherry pounds per acre per month, and 20% saleable green-bean recovery after processing losses and defects. Annual crop realization rises from approximately 20.83% in 2026 to 29.17% in 2030.
Seasonal factors peak in October and November and are zero from April through June. The launch date governs active months, with no immediate harvest from newly planted acreage.
The Revenue Forecast organizes the orchard’s acreage, cherry-production ceiling, processing recovery, crop realization, and seasonal volume controls. It allocates the resulting green beans once across five saleable grades, with a separate per-pound selling price for each grade.
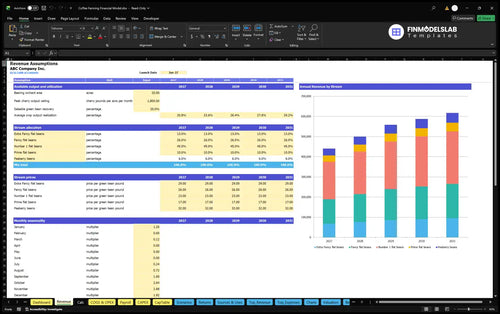
18,000 saleable green pounds × $24.50 weighted selling price per pound = $441,000 projected revenue.
Extra Fancy, Fancy, Number 1, Prime, and Peaberry account for 13%, 26%, 45%, 10%, and 6% of saleable pounds, respectively. At the selected $29, $26, $23, $17, and $32 prices per pound, their weighted selling price is $24.50.
Volume realization changes saleable pounds, while grade mix and prices change revenue per pound. Every pound is assigned once.
Direct costs and selling allowances depend on revenue, while farm overhead and fixed base salaries follow their own spending and staffing inputs.
COGS total 2.5% of revenue for packaging materials and outside grade inspection. Variable operating expenses total 4.5% for delivery, commissions, payment charges, and the wholesale excise allowance; neither category contains base employee pay.
The COGS and Operating Expenses forecast separates sales-linked charges from fixed farm costs, including lease, fertilizer, crop protection, utilities, repairs, insurance, and administration.
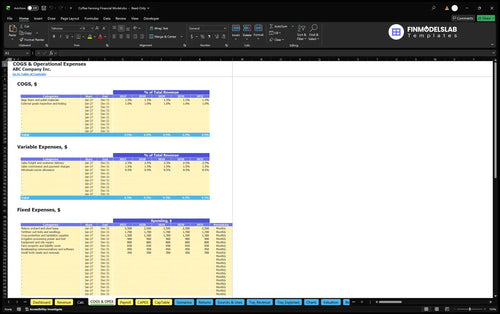
Fixed expenses are projected at $103,200 annually, including a $2,500 monthly orchard and shed lease. Edit fixed-cost inputs independently of harvest volume.
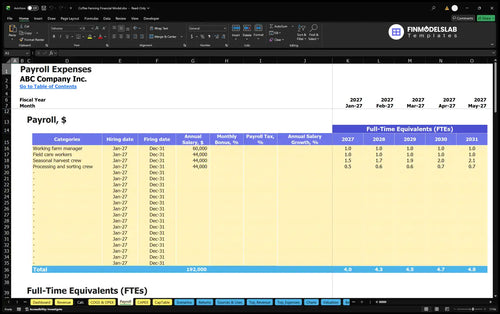
The Payroll Forecast plans farm management, field care, harvest, and processing roles by annual-average FTE and base pay. The 2026 case includes $192,000 of payroll, separate from COGS.
Opening equipment, setup cash, working capital, and owner contributions are funding inputs, not additional annual operating expenses.
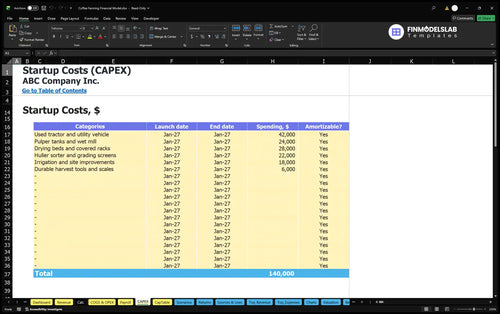
The case budgets $140,000 of startup assets, including a $42,000 used tractor and utility vehicle, $24,000 wet mill equipment, $28,000 drying facilities, and $22,000 of hulling and sorting equipment. Irrigation improvements and durable harvest tools make up the remaining asset allocation.
The Capital Expenditure Plan schedules equipment purchases and tracks depreciation and net book value. It separates initial processing investment from recurring overhead and annual operating EBITDA.
The opening plan also includes $21,000 of separate setup cash, $29,541 of opening net working capital, and an $81,518 reserve. The working-capital controls use 24 receivable days, 9 payable days, and 27 inventory days.
The documented $272,058 initial funding is owner-supplied, with no committed external financing. The reserve equals three months of first-year outflows; it is not proof of sufficient liquidity during the seasonal harvest peak.
The Sources and Uses of Funds report reconciles cash sources with operating, investment, and financing uses. Review equity funding and equipment spending without classifying owner contributions as revenue.
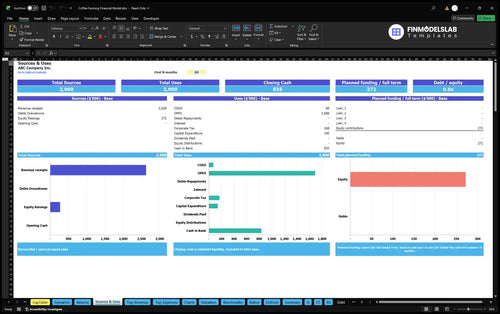
The documented base case projects growing green-coffee sales and positive EBITDA while tracking the associated cost of production and staffing.
| Year | Revenue | Operating Expenses | EBITDA |
|---|---|---|---|
| 2026 | $441,000 | $326,070 | $114,930 |
| 2027 | $499,800 | $341,626 | $158,174 |
| 2028 | $558,600 | $357,622 | $200,978 |
| 2029 | $588,000 | $365,840 | $222,160 |
| 2030 | $617,400 | $373,618 | $243,782 |
Model-generated planning scenario, not historical coffee-farm results or an industry average.
Revenue grows in this scenario because the modeled crop-realization assumption increases, not because green-bean prices rise. In 2030, direct costs are $15,435, variable expenses $27,783, fixed expenses $103,200, and payroll $227,200, producing $243,782 of EBITDA.
The workbook includes additional financial statements, but the supplied case does not substantiate net income, cash sufficiency, or balance-sheet totals.
The Cash Flow Forecast tracks operating, investing, and financing cash movement, including receivable, payable, and inventory timing. Review funding, capital purchases, and potential seasonal liquidity needs separately from EBITDA.
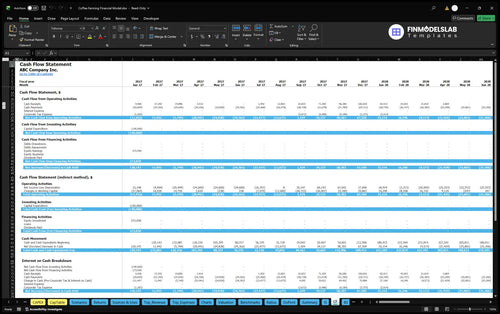
The workbook provides distinct analyses for operating coverage, investment recovery, scenario variation, and financing choices.
Low, Base, and High controls can vary revenue, COGS, variable costs, fixed costs, and payroll. Alongside editable crop realization and grade prices, they help test operating margins under different conditions.
The Dashboard controls up to four optional debt facilities. This example assumes owner funding only and establishes no loan offer or borrowing requirement.
The Returns analysis distinguishes sales break-even, cash break-even, investment payback, and annual ROIC. These measures need different inputs and cannot be inferred from positive EBITDA.
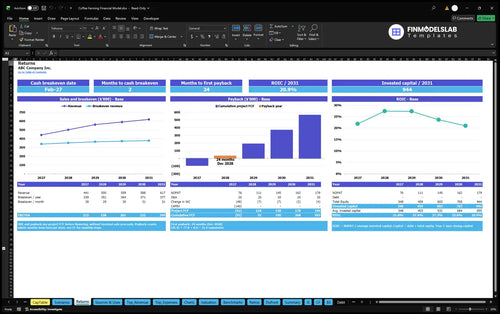
Valuation and benchmark reports support sensitivity and user-entered KPI comparisons. The case does not establish a valuation, verified industry benchmark, payback period, or ROIC result.
Use this Excel model to build a transparent forecast around a producing green-coffee orchard rather than a cafe or roasting business.
Use it to assess a mature orchard takeover, harvest volumes, grade yields, seasonal payroll, processing equipment, and funding scenarios.
These answers clarify the orchard scope, editable drivers, reports, and limits of the illustrated projections.
No. The documented operation sells green Arabica coffee beans in five grades to specialty roasters, with on-farm processing but no roasting, cafe, tours, or purchased-coffee resale.
Yes. Edit bearing acreage, cherry yield ceiling, green recovery, crop realization, seasonal factors, grade shares, and selling prices to update the revenue projection.
Yes. Field, harvest, and processing labor are planned as annual-average FTE with fixed base pay; their salaries are not added a second time to COGS.
Yes. The declared workbook includes projected Income Statement, Cash Flow, and Balance Sheet reports, alongside dashboards and supporting analysis schedules.
No. In the illustrated scenario, $272,058 is the planned initial owner funding; no outside loan or other committed financing is assumed.
No. The 2030 figure is illustrative operating EBITDA, before depreciation, interest, taxes, and other items needed to determine net income or cash flow.
Yes. Returns reports distinguish sales break-even, cash break-even, project payback, and ROIC, but the supplied case does not establish a numerical payback date or return.
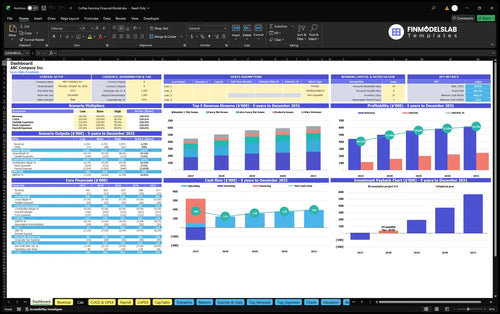
KPIs, forecasts, and cash flow at a glance.
Key assumptions and calculations driving revenue forecasts.
Funding sources, spending, and closing cash.
Cash break-even, payback, and ROIC.
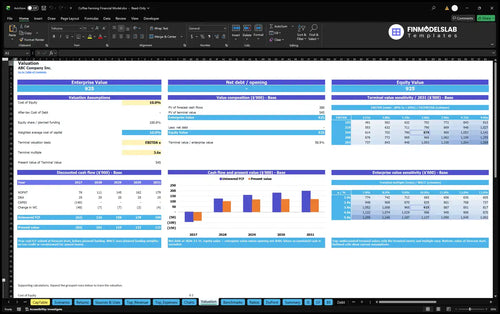
DCF valuation and sensitivity analysis.
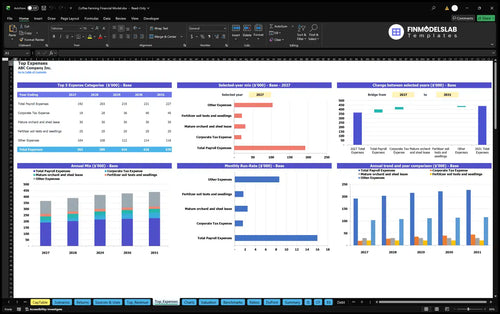
Largest costs and spending trends.
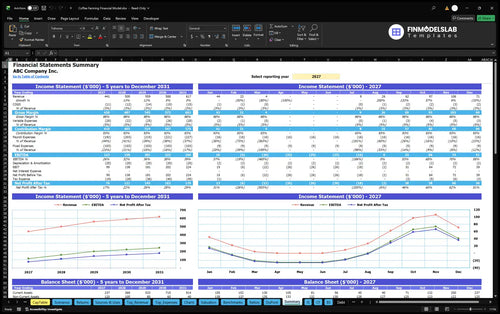
Annual and monthly financial performance.
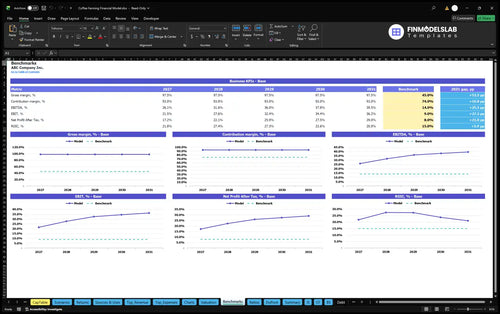
Compare margins and returns to benchmarks.

This template finally made margins and break-even easy to see, so I could spot the weak spots in my coffee farm plan in one sitting. It saved me hours of guessing and gave me a cleaner profit picture for lenders.

I was tired of hunting through different files for statements and charts. Having everything in one model cut my prep time by a full day and made my update meeting much easier to run.
The pricing, cost, and growth inputs were laid out in a way that actually made sense. I cleaned up my assumptions in under an hour and finally had numbers I could explain without getting lost.