

Revenue and Calc
Change store visits, checkout conversion, seasonal demand, merchandise basket allocation, and category prices; monthly calculations connect those inputs to revenue.


The Comic Book Store Financial Model is an Excel financial planning template for a neighborhood comics retailer. It builds sales from store traffic, checkout conversion, the merchandise mix, and basket prices, then connects those sales to direct costs, operating expenses, staffing, and financial reports.
The documented example models an owner-operated, 1,500-square-foot store in the secondary Denver metro area, with in-store sales only and a 2026–2030 planning horizon. Its figures are editable scenario projections, not observed store performance or industry averages.
Editable operating inputs feed monthly calculations, financial statements, and reports designed for store-level decisions.
Change store visits, checkout conversion, seasonal demand, merchandise basket allocation, and category prices; monthly calculations connect those inputs to revenue.
Plan merchandise costs, freight, shrink, payment fees, recurring occupancy expenses, and staffing by role without duplicating payroll.
Enter fixture and improvement spending, opening contributions, working-capital days, and optional borrowing terms in the relevant schedules.
Review income statement, cash flow, balance sheet, scenarios, break-even, payback, ROIC, valuation, charts, and model checks as applicable.
Sales depend on the number of customers who enter the shop, the share who make a purchase, and the basket category and price.
Each month, store visits × purchase conversion × one seasonal multiplier determines total checkouts. Each checkout is allocated once to its dominant category: new issues (40%), graphic novels (22%), manga (15%), back issues (15%), or licensed merchandise (8%).
The store model begins with 1,700 visits per month and 50% conversion in 2026, reaching 2,700 visits and 54% conversion by 2030. Basket prices are separately editable by category and year; an estimated annual seasonality pattern adjusts monthly volume.
The Revenue Forecast translates store visits, purchases, merchandise mix, and category-specific basket prices into sales by stream. The linked Calc worksheet applies launch timing and monthly seasonality before consolidating annual revenue.
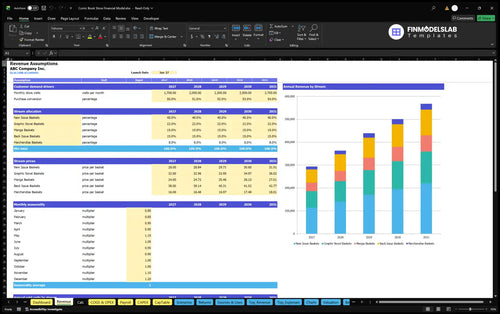
1,700 visits × 50% conversion × $28.82 weighted basket = $24,497 in sales before monthly seasonality.
The example uses a seasonal factor of 0.85 in January and 1.20 in December, with the twelve factors totaling 12. This changes the monthly profile without multiplying the full-year revenue twice. The 2026 example produces $293,964 in annual revenue.
The model separates merchandise cost of goods sold, checkout-related variable expenses, fixed store expenses, and salaries.
The documented cost assumptions are 54% of revenue for merchandise purchases, 1.2% for inbound freight, and 1.8% for stock loss or damage. Payment processing adds 3% and checkout wrapping adds 0.5% as variable operating expenses.
Fixed inputs cover occupancy, utilities, insurance, marketing, software, bookkeeping, repairs, security, and permits. Example rent starts at $3,000 per month in 2026 and rises annually, while the other expense lines follow their own input schedules.
The COGS & Operating Expense Forecast separates merchandise-related direct costs from variable checkout expenses and recurring fixed costs. Reviewing these lines helps assess the gross and contribution margins needed to cover the store’s staffing and occupancy.
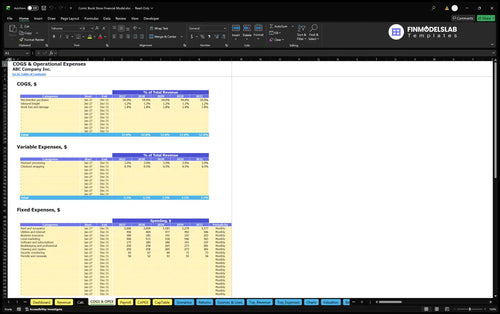
The 2026 case allocates $167,559 to direct costs, $10,289 to variable operating expenses, and $59,040 to fixed operating expenses. These are modeled expense amounts, not expense benchmarks for other comic stores.
The Payroll Forecast models salaries and annual-average full-time-equivalent staffing by role. The example includes one owner store manager at $48,000 annually and retail associates starting at 0.75 FTE with a $36,000 annual base per FTE.
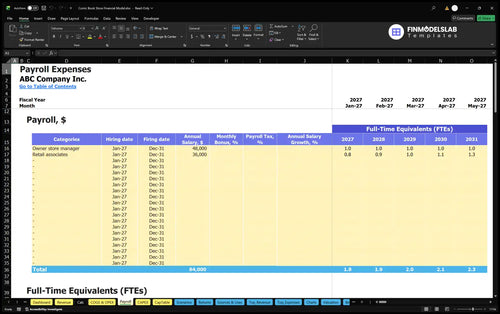
In the illustrated 2026 operating case, $75,000 of base payroll is separate from direct, variable, and fixed cost lines; the supplied case excludes employer payroll taxes and benefits.
Store-opening assets and preopening payments are budgeted separately from the annual revenue and EBITDA forecast.
The opening plan includes display and storage fixtures, leasehold improvements, checkout and security equipment, and permanent signage. Separate cash items include the lease deposit, formation costs, launch marketing, preopening occupancy, staffing, and systems setup.
The Capital Expenditure Plan schedules purchases, expenditure dates, and depreciation assumptions for eligible assets. It helps distinguish the initial store fit-out from recurring operating expenses and supports the workbook’s investing and asset reports.
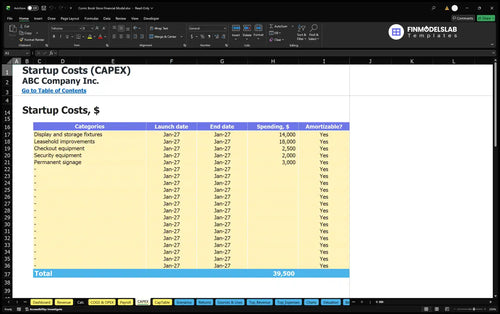
The illustration budgets $39,500 in durable opening assets and $18,500 in other startup cash, plus opening inventory counted once and a separate three-month operating reserve. The estimated owner funding input is $191,060, with no committed external financing assumed.
The Sources and Uses of Funds report organizes equity or debt sources against inventory, startup investment, operating cash needs, and retained cash. Users can compare the intended opening funding mix with projected cash requirements over selected periods.
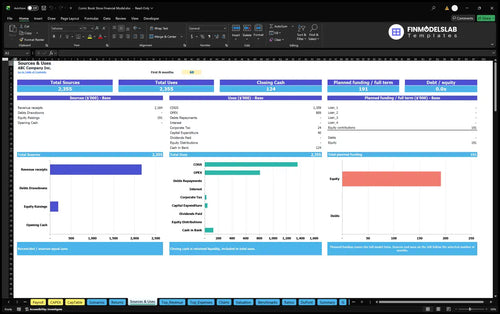
The $191,060 opening owner contribution is a planning estimate, not a tested peak cash-flow requirement. Accounts-receivable and payable days are zero, while inventory days are 120.
In the documented base case, rising visits, conversion, and basket prices improve projected operating earnings over the 2026–2030 period.
| Year | Revenue | Operating Expenses | EBITDA |
|---|---|---|---|
| 2026 | $293,964 | $311,888 | −$17,924 |
| 2027 | $363,340 | $361,032 | $2,308 |
| 2028 | $438,828 | $412,126 | $26,702 |
| 2029 | $500,759 | $455,074 | $45,685 |
| 2030 | $567,504 | $502,790 | $64,714 |
Annual figures are illustrative model outputs rounded to whole dollars; displayed differences may reflect rounding.
The example moves from negative $17,924 EBITDA in 2026 to positive $2,308 in 2027 and $64,714 by 2030. EBITDA is revenue less the modeled direct, variable, fixed, and payroll costs; it does not equal net profit or available cash.
The workbook also contains projected income statement, balance sheet, and monthly cash flow reports. Those reports incorporate additional workbook inputs such as depreciation, financing, tax, investment, and working capital; no unprovided amounts from those reports are assumed here.
The Cash Flow Forecast separates operating receipts and payments from investing and financing movements. Use it to examine stock purchases, fit-out spending, owner contributions, debt activity if entered, and the resulting cash position rather than treating EBITDA as liquidity.
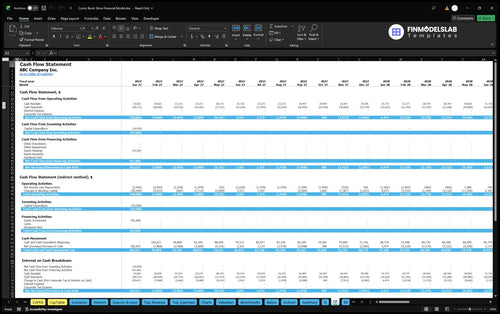
The model includes separate reports for operating coverage, investment recovery, capital returns, and scenario differences.
The Return on Invested Capital Analysis combines sales break-even, cash break-even, investment payback, and annual ROIC measures. These answer different questions about covering operating costs, recovering cash invested, and generating a return on capital.
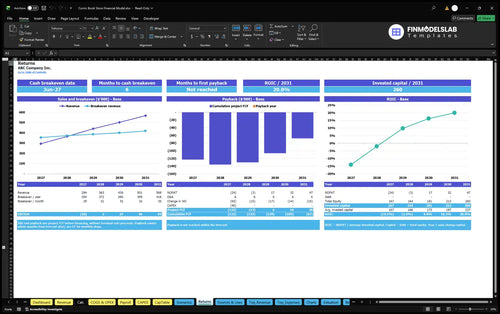
Sales break-even indicates when projected sales cover the relevant operating cost structure; cash break-even follows actual cash timing. Investment payback tracks cumulative project cash flow, while annual ROIC measures return relative to invested capital. None can be inferred reliably from EBITDA alone.
The Financial Scenario Analysis compares Low, Base, and High revenue, direct-cost, variable-expense, fixed-expense, and payroll multipliers. Compare resulting revenue, margins, and EBITDA to test how traffic weakness or higher store expenses affect the operating case.
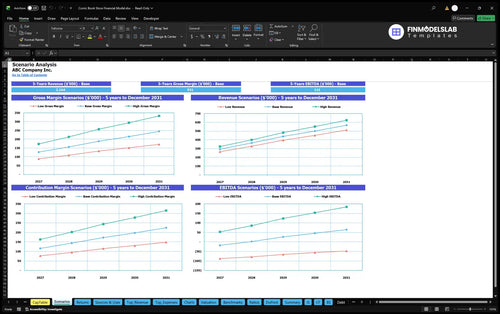
Other available analyses include discounted cash flow valuation, benchmark comparisons using entered reference values, trend charts, and checks. The supplied case does not establish any specific valuation, payback month, benchmark result, loan approval, or realized investment return.
Answers about the Excel model, its sales logic, assumptions, and financial reports.
Yes. The Revenue inputs allow the number of monthly visitors and purchase conversion to vary by forecast year.
Yes. Each checkout is assigned to one dominant basket category so total visits are not counted across multiple revenue streams.
Yes. Inventory days are editable; the documented case uses 120 days and identifies opening stock separately from durable startup assets.
No. The forecast is an illustrative, editable planning case rather than a prediction or an industry average.
Yes. Dashboard debt controls, CapTable contributions, Debt schedules, and cash flow reporting support entered financing assumptions; the case assumes no committed external funding.
No. EBITDA excludes investing, financing, and other cash timing effects; review the Cash Flow and Balance Sheet reports for liquidity.
Yes. Change traffic and conversion assumptions or compare Low, Base, and High scenario multipliers to examine the effect on sales and EBITDA.
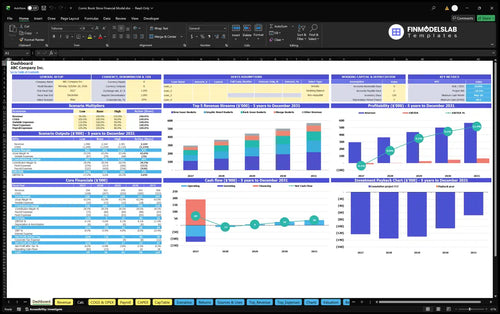
KPIs, forecasts, and cash flow at a glance.
Key assumptions and calculations driving revenue forecasts.
Funding sources, spending, and closing cash.
Cash break-even, payback, and ROIC.
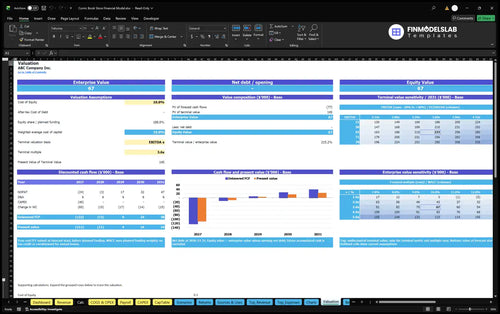
DCF valuation and sensitivity analysis.
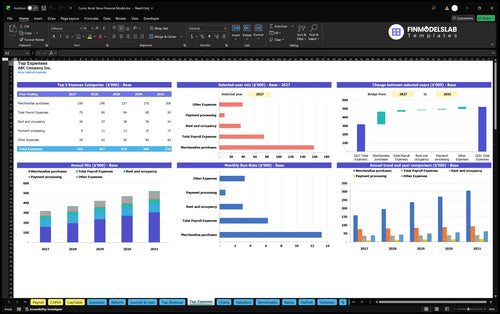
Largest costs and spending trends.
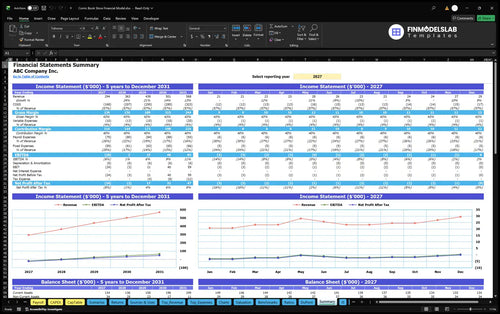
Annual and monthly financial performance.
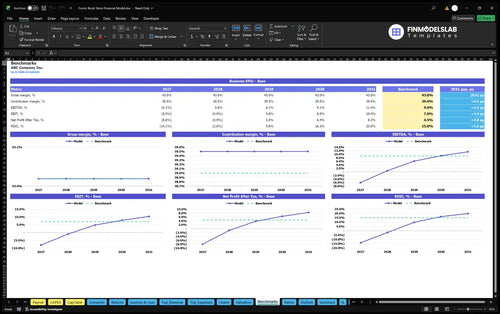
Compare margins and returns to benchmarks.

The built-in formulas kept one bad cell from snowballing into a mess, so I could trust the numbers before my lender call. It saved me a full day of rechecking.

Pricing, costs, and growth are laid out in one place, which made it much easier to test scenarios without losing track. I had cleaner assumptions ready for my meeting two hours sooner.
I didn’t have to face a blank sheet, and that alone made a big difference. The template gave me a working model in under an hour instead of spending a weekend building from zero.