

Acquire Customers
New customers equal marketing spend divided by customer acquisition cost.


It is an editable five-year Excel or Google Sheets workbook for customer acquisition, membership retention, monthly fees, scenarios, and linked financial statements.
Use the model to plan how marketing-driven member acquisition, membership-tier mix, retention, and monthly fees translate into revenue, costs, cash flow, and profitability.
Editable assumptions feed revenue and operating schedules, which flow into scenario views, the dashboard, and projected income, cash flow, and balance sheet statements.
Revenue starts with marketing spend and CAC, allocates new customers across membership tiers, retains each cohort, applies monthly fees, and totals revenue across tiers and months.
New customers equal marketing spend divided by customer acquisition cost.
New customers are distributed across membership tiers using editable allocation percentages.
Starting and unexpired customer cohorts remain active under the lifetime or churn convention.
Each tier multiplies active customers by its monthly fee per active customer.
Monthly tier revenue is summed across tiers and months to produce total revenue.
The Revenue Assumptions view connects marketing budgets and CAC with starting customers, tier allocation, cohort lifetime, monthly fees, seasonality, and active-customer growth.
 REVENUE ASSUMPTIONS
The COGS & OPEX view separates direct service costs, variable expenses, and fixed overhead so cost assumptions flow through margins and cash planning.
 COGS & OPEX
The Scenarios view compares Low, Base, and High cases across revenue, gross margin, contribution margin, and EBITDA over the five-year forecast.
 SCENARIOS
The Dashboard combines setup, scenario controls, financing assumptions, key metrics, core financials, revenue mix, cash flow, profitability, and payback reporting.
 DASHBOARD
The ready-made model fits recurring membership-cohort economics, while structurally different pricing, operating drivers, or reporting requirements may call for custom modeling.
The template is a planning starting point, not a guarantee of performance.
Financial Models Lab can build or adapt a model when your revenue logic, operating schedules, or reporting requirements differ from the ready-made structure.
ORDER A CUSTOM FINANCIAL MODELAfter checkout, you receive an instantly downloadable, fully editable Excel financial model with a five-year forecast, scenario analysis, and linked financial reports.
Open the Excel model and replace the planning assumptions with your own inputs.
Review a five-year projection with monthly and annual planning detail across linked schedules.
Compare Low, Base, and High cases through the workbook's scenario controls and charts.
Review the projected income statement, cash flow statement, balance sheet, dashboard, and supporting reports.
The essential answers are visible in full, with no accordion clicks required.
It calculates new customers from marketing spend and CAC, allocates them across membership tiers, retains active cohorts, applies monthly fees, and totals tier revenue.
You can change the launch date, starting customers, annual marketing budget, monthly seasonality, CAC, tier allocation, customer lifetime or churn convention, and monthly fees.
They let you compare alternative outcomes for revenue, gross margin, contribution margin, and EBITDA across the five-year forecast.
The workbook includes the Dashboard, income statement, cash flow statement, balance sheet, Summary, Break-Even, ROIC, Valuation, Charts, KPIs, and supporting reports.
Yes. Financial Models Lab offers custom financial modeling when you need different revenue logic, operating schedules, or financial outputs.
It is a planning forecast based on editable assumptions, not a guarantee of revenue, profitability, funding, or business performance.
You get a complete, easy-to-use Excel template for concierge medical practice financial planning, including a dashboard, 5-year forecasts, and detailed assumption sheets.
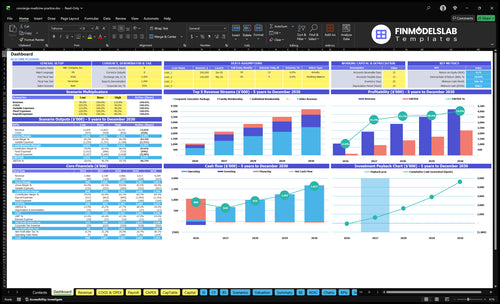
Core inputs and core outputs
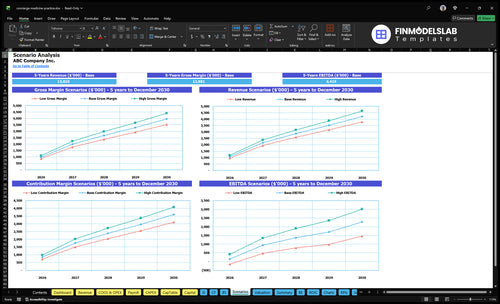
Three scenario analysis
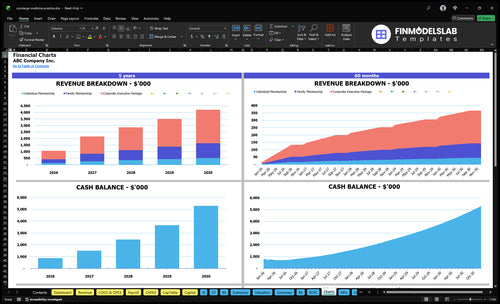
Presentation ready

DuPont analysis
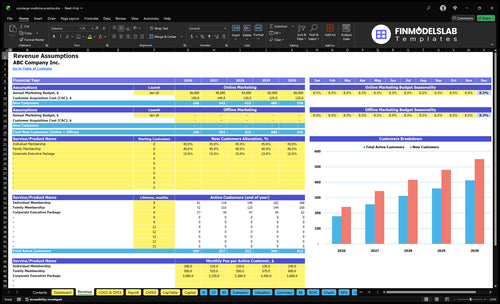
Researched revenue assumptions
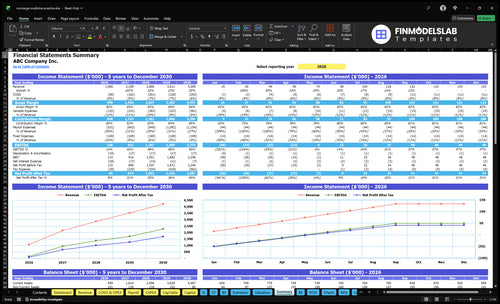
Lender-friendly financial outputs

Revenue stream detailed view
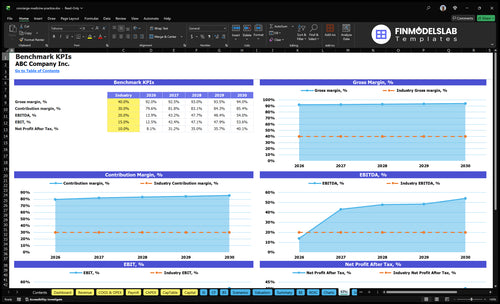
Performance metrics benchmark

This template pulled pricing, costs, and growth into one clean setup, so I stopped juggling messy tabs and saved about 6 hours. It made the numbers easier to explain to my partner, too.
I’m not strong in Excel, and this model kept the advanced parts out of my way. I was able to finish the forecast and send it to my advisor the same afternoon.

The margin and break-even view made the story of the business much clearer right away. I could see where the model turned profitable and had a cleaner discussion with my lender.