

Acquire Customers
Calculate new customers from marketing spend divided by customer acquisition cost.


The Concrete Pumping Service Financial Model is an editable five-year workbook linking customer acquisition, retained cohorts, billable hours, hourly rates, costs, scenarios, and financial statements.
Use the workbook to plan how marketing spend, acquisition cost, service mix, customer retention, billable hours, and hourly rates translate into revenue, costs, cash flow, and profitability.
Editable assumptions feed monthly customer-cohort calculations that roll into Low, Base, and High scenarios, financial statements, the Dashboard, and management reports.
The model acquires customers from marketing spend and CAC, retains cohorts by service tier, converts active customers to billable hours, and applies hourly rates.
Calculate new customers from marketing spend divided by customer acquisition cost.
Allocate new customers across service tiers and keep each cohort active for its stated lifetime.
Add starting customers to all customer cohorts still active in each month.
Multiply active customers by average billable hours per active customer each month.
Multiply billable hours by the tier hourly rate, then total revenue across tiers and months.
The Revenue sheet connects marketing budget, CAC, service-tier allocation, customer lifetime, starting customers, billable hours, hourly rates, and monthly seasonality.
 REVENUE
The COGS & OPEX sheet separates pumping direct costs, variable operating expenses, and fixed overhead across annual assumptions and monthly forecast periods.
 COGS & OPEX
The Scenarios view compares Low, Base, and High cases for revenue, gross margin, contribution margin, and EBITDA throughout the five-year forecast.
 SCENARIOS
The Dashboard combines model setup, scenario controls, key metrics, core financials, revenue mix, profitability, cash flow, and investment payback views.
 DASHBOARD
The ready-made model fits client-cohort services billed by the hour, while materially different revenue logic, operating schedules, or reporting structures may call for custom modeling.
The template is a planning starting point, not a guarantee of performance.
Financial Models Lab can build or adapt a model when you need different revenue logic, operating schedules, or reporting from the ready-made structure.
ORDER A CUSTOM FINANCIAL MODELAfter checkout, you receive the editable five-year Excel financial model for instant download, with revenue inputs, scenarios, statements, and management views.
Change launch timing, marketing budget, CAC, service mix, customer lifetime, billable hours, hourly rates, costs, and planning assumptions.
Review monthly and annual projections across the five-year forecast horizon.
Compare Low, Base, and High cases across revenue, margins, and EBITDA.
Review the income statement, cash flow, balance sheet, Summary, Dashboard, and related reports.
The essential answers are visible in full, with no accordion clicks required.
It calculates new customers from marketing spend and CAC, retains cohorts by service tier, converts active customers into billable hours, and applies hourly rates.
You can edit launch date, starting customers, marketing budget and seasonality, CAC, tier allocation, customer lifetime, billable hours, and hourly rates.
You can compare Low, Base, and High cases across revenue, gross margin, contribution margin, and EBITDA in the scenario view.
The workbook includes the Income Statement, Cash Flow Statement, Balance Sheet, Dashboard, Summary, Break-Even, ROIC, Charts, KPIs, Ratios, and Valuation.
Yes. Financial Models Lab can build or adapt a financial model around different revenue logic, operating schedules, or reporting requirements.
It is a forecast based on editable assumptions, not a guarantee of business performance.
This single file contains everything required to build a complete financial plan, from detailed assumptions and revenue modeling to pro forma financial statements and a dynamic dashboard.

Core inputs and core outputs

Three scenario analysis
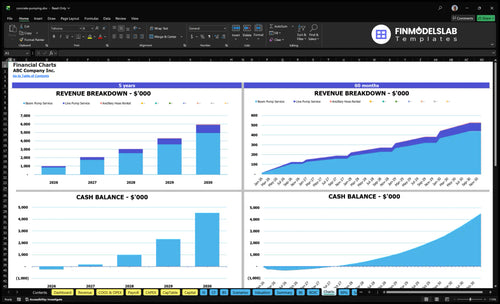
Presentation ready

DuPont analysis

Researched revenue assumptions

Lender-friendly financial outputs

Revenue stream detailed view

Performance metrics benchmark

This template kept one broken cell from turning into a mess, so I could trust the numbers before my lender call. It saved me hours of tracing formulas and made the forecast much easier to review.
Starting from scratch felt like the hardest part, but this gave me a full structure right away. I had a working concrete pumping forecast in one afternoon instead of spending days staring at an empty spreadsheet.

I don’t build advanced models, so the clear tabs and inputs made this easy to follow. I got a polished projection set up without hiring extra help, and that kept the planning process moving.