

Set Program Capacity
Set the launch date, education groups, available places, and timing of capacity additions.


The Continuing Education Provider Financial Model is an editable five-year workbook linking available learning places, occupancy, pricing, costs, scenarios, and financial statements.
Use the workbook to plan how program capacity, occupancy, monthly fees, ancillary revenue, and timing translate into education revenue, operating costs, cash flow, and profitability.
Editable assumptions feed monthly operating calculations that roll into Low, Base, and High scenarios, financial statements, the Dashboard, and management reports.
The model converts available program places into occupied places, applies monthly fees and optional ancillary revenue, then totals active-month revenue across education groups.
Set the launch date, education groups, available places, and timing of capacity additions.
Multiply available places by the occupancy rate or occupancy ramp for each group.
Multiply occupied places by the monthly fee per occupied place for each group.
Add extra monthly revenue per occupied place when that ancillary revenue stream is enabled.
Sum group revenue by month, then total active months after launch timing and any seasonal pattern.
The Revenue sheet sets group capacity, occupancy rates, monthly fees, extra revenue per occupied place, launch timing, and forecast-year assumptions.
 REVENUE
The COGS & OPEX sheet separates direct program costs, variable operating expenses, and fixed expenses across monthly forecast periods.
 COGS & OPEX
The Scenarios view compares Low, Base, and High cases for revenue, gross margin, contribution margin, and EBITDA across the five-year forecast.
 SCENARIOS
The Dashboard combines model setup, scenario controls, key metrics, core financials, revenue mix, profitability, cash flow, and investment payback views.
 DASHBOARD
The ready-made model fits occupied-capacity education providers, while materially different revenue logic, operating schedules, or reporting structures may call for custom modeling.
The template is a planning starting point, not a guarantee of performance.
Financial Models Lab can build or adapt a model when your requirements call for different revenue logic, operating schedules, or reporting structures.
ORDER A CUSTOM FINANCIAL MODELAfter checkout, you receive the editable five-year Excel and Google Sheets financial model for instant download, with revenue inputs, scenarios, statements, and management views.
Change program capacity, occupancy, fees, ancillary revenue, costs, timing, and planning assumptions for your operating case.
Review monthly and annual projections across the five-year forecast horizon.
Compare Low, Base, and High cases across revenue, margins, and EBITDA.
Review the income statement, cash flow, balance sheet, Summary, Dashboard, and related reports.
The essential answers are visible in full, with no accordion clicks required.
It calculates occupied places from available program capacity and occupancy, then applies monthly fees and optional ancillary revenue before totaling active-month revenue.
You can edit group definitions, available places, occupancy rates or ramps, monthly fees, extra revenue per place, capacity timing, active months, and seasonality when used.
You can compare Low, Base, and High cases across revenue, gross margin, contribution margin, and EBITDA in the scenario view.
The workbook includes the income statement, cash flow, balance sheet, Dashboard, Summary, break-even, ROIC, Charts, KPIs, Ratios, and Valuation.
Yes. Financial Models Lab can build or adapt a financial model around different revenue logic, operating schedules, or reporting requirements.
It is a forecast based on editable assumptions, not a guarantee of business performance.
This Excel financial model for continuing education startup provides everything you need to build a comprehensive financial plan, from revenue forecasting to valuation.
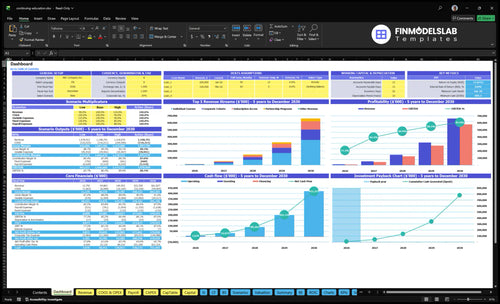
Core inputs and core outputs
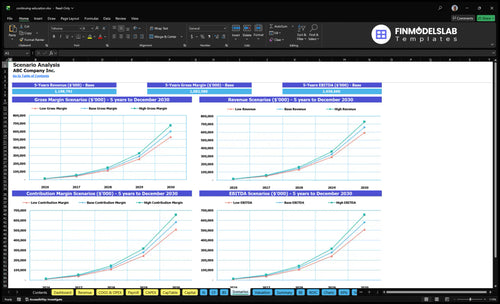
Three scenario analysis
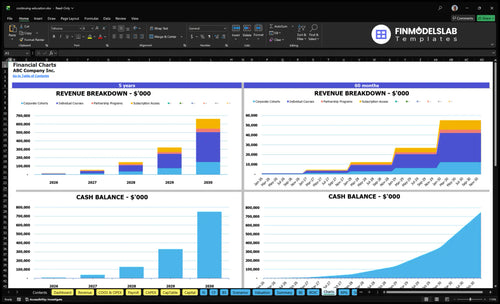
Presentation ready
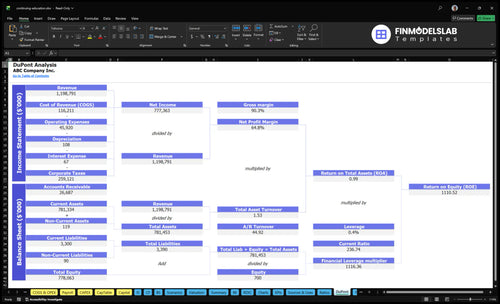
DuPont analysis
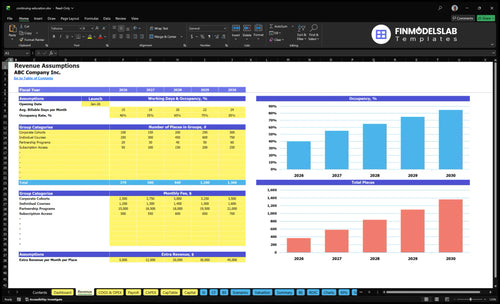
Researched revenue assumptions
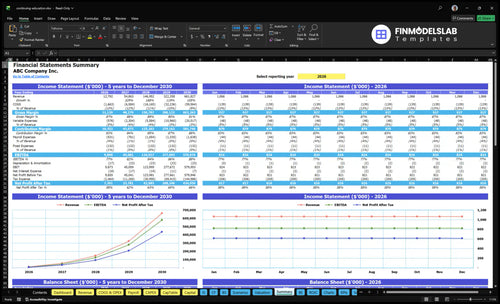
Lender-friendly financial outputs

Revenue stream detailed view
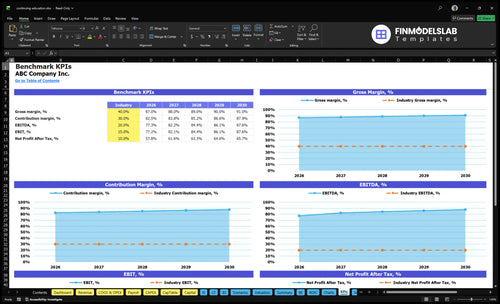
Performance metrics benchmark

The break-even view made our margins finally easy to see, so we could spot weak pricing before it became a problem. It turned a messy spreadsheet into something we could actually explain.
I opened the template and knew right away what investors wanted to see. The structure helped us build a cleaner deck and get a meeting booked faster.

Building the financials by hand would have eaten up our week, but this template cut the work down to a few hours. We used the saved time to refine our course plan instead.