

Revenue and Calc
Set orders, trading days, basket shares, and selling prices. Calc builds monthly sales by basket.


The Donut Shop Financial Model is an Excel financial model for planning an independent retail donut bakery. It turns daily paid orders, five basket prices, operating costs, staffing, and startup investment assumptions into a monthly forecast and connected financial reports.
The illustrated case represents a 1,200-square-foot suburban U.S. bakery with counter service and prepaid pickup, trading 26 days per month. The forecast covers 2026 through 2030; its assumptions and outcomes are estimates, not actual store performance or industry averages.
The template links bakery-specific operating inputs to monthly calculations, financial statements, and decision-oriented reporting.
Set orders, trading days, basket shares, and selling prices. Calc builds monthly sales by basket.
Plan ingredients, packaging, processing, marketing, overhead, and staffing separately.
Schedule bakery assets, equity contributions, and optional debt facilities, including repayments and interest.
Review projected income, cash flow, and balance sheet reports; supplied case results stop at EBITDA.
Compare scenarios with Dashboard, Returns, Sources & Uses, Valuation, Charts, and Checks.
Revenue is driven by one paid-order pool, allocated among five complete basket types rather than independently forecast product quantities.
Edit orders, trading days, basket allocations, and annual prices. Categories are Single Classic Donut, Donuts and Coffee Combo, Classic Half Dozen, Classic Dozen, and Premium Dozen.
Shares are 20%, 30%, 20%, 20%, and 10%, with the fifth calculated as a residual. The combo includes coffee once.
The Revenue Forecast translates one pool of daily paid orders into basket quantities and revenue using trading days, mix percentages, and complete ticket prices. Adjust demand or realized price to see how each sales stream changes.
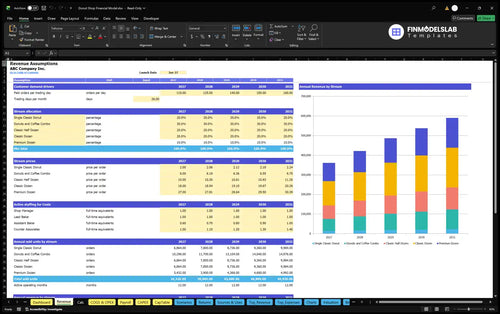
110 paid orders per day × 26 trading days × $10.50 weighted basket price = $30,030 per modeled month.
Daily orders rise from 110 to 160 by 2030, with 26 trading days monthly. The 2026 weighted ticket is $10.50.
Orders are zero before the January 31, 2026 launch; that month is modeled in full. There is no separate capacity constraint, wholesale, or marketplace delivery.
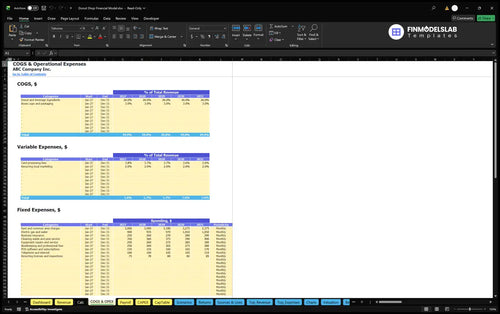
The expense forecast separates sales-linked ingredient and selling costs, monthly overhead, and base salaries so each component is counted once.
Ingredients cost 26% of revenue; packaging costs 3%. Card processing declines from 3.8% to 3.6%, and local marketing remains 2%.
Fixed costs cover rent, utilities, insurance, cleaning, repairs, bookkeeping, software, communications, and licenses. Monthly rent rises from $3,000 to $3,375.
The COGS and Operating Expenses forecast separates direct food and packaging costs from variable payment and marketing charges and recurring fixed shop expenses. It helps test the EBITDA effect of changes in sales and cost assumptions.
The Payroll Forecast organizes FTE, annual salaries, and staffing schedules for the shop manager, lead baker, assistant baker, and counter associates. Salary planning is separate from ingredient and overhead assumptions to avoid counting the same wages twice.
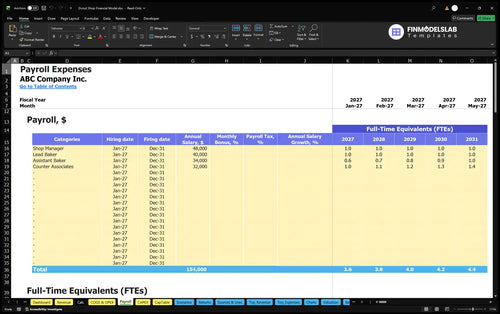
The manager earns $48,000 and lead baker $40,000 annually. By 2030 assistant bakers rise from 0.6 to 1.0 FTE; counter associates rise from 1.0 to 1.4 FTE, at $34,000 and $32,000 per FTE.
The illustrative expense scope excludes employer payroll taxes, benefits, and personal taxes; tailor these to your location.
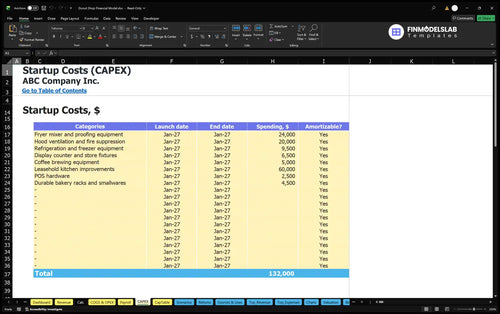
Opening investment is planned independently of ongoing shop expenses and EBITDA, including equipment, preopening payments, working capital, and reserves.
Startup assets include $24,000 for fryer/mixer/proofing equipment, $20,000 for ventilation/fire suppression, $9,500 for refrigeration, and $6,500 for display fixtures, plus other bakery equipment.
Other opening payments cover permits, refundable deposits, preopening training and payroll, and launch marketing; they are outside annual operating expenses.
The Capital Expenditure Plan schedules bakery equipment and other eligible capital purchases, alongside depreciation and net book value. It distinguishes asset spending from the operating cost assumptions used to calculate EBITDA.
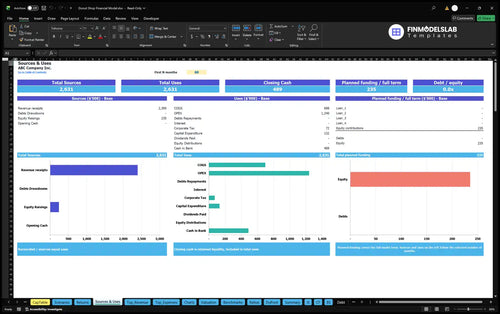
Working-capital controls are zero receivable days, seven payable days, and 14 inventory days. Estimated owner funding of $235,431 includes opening assets, cash uses, working capital, and a three-month outflow reserve.
The Sources and Uses of Funds report organizes equity, debt, cash receipts, operating payments, and investment spending over a selected period. Use it to connect the opening bakery budget with the planned funding mix and cash allocation.
The example shows how changes in paid-order volume, basket pricing, shop expenses, and staffing flow into projected operating EBITDA.
| Year | Revenue | Operating Expenses | EBITDA |
|---|---|---|---|
| 2026 | $360,360 | $329,705 | $30,655 |
| 2027 | $421,785 | $359,335 | $62,450 |
| 2028 | $486,508 | $390,578 | $95,930 |
| 2029 | $536,843 | $416,352 | $120,491 |
| 2030 | $589,855 | $443,610 | $146,245 |
Forecast estimates rounded to whole dollars; totals may differ slightly due to displayed rounding.
Revenue rises from $360,360 to $589,855, and expenses from $329,705 to $443,610. EBITDA rises from $30,655 to $146,245 between 2026 and 2030.
EBITDA is not net profit or free cash flow. Depreciation, interest, tax, investment purchases, working-capital movements, and financing activity require their own schedules before assessing accounting earnings or liquidity.
The Cash Flow Forecast tracks operating, investing, and financing cash movements and reconciles opening to closing cash. Review it separately from EBITDA to assess the timing of equipment outlays, debt service, owner contributions, and potential liquidity shortfalls.
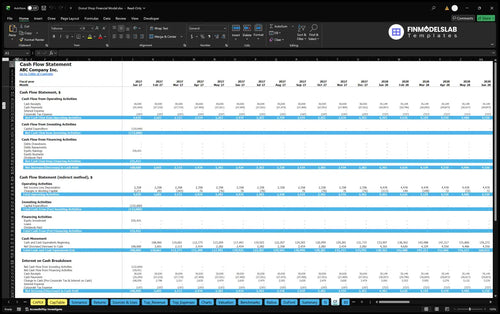
Monthly Income Statement, Balance Sheet, and Summary reports are included, but the source supplies no net profit, closing cash, or debt balance values.
Use the model reports to evaluate required sales, operating profitability, cash recovery, and sensitivity without treating those measures as interchangeable.
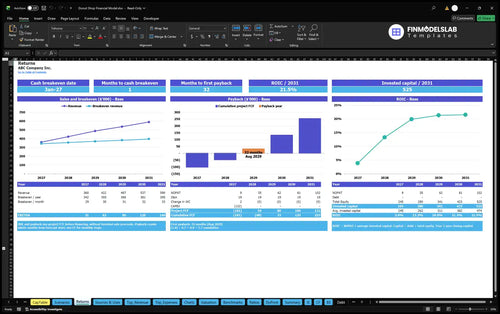
Returns separates sales break-even, cash break-even, investment payback, and annual ROIC. Sales break-even tests operating cost coverage; the other measures depend on cash timing or invested capital.
The Returns analysis brings together break-even requirements, project cash flows, investment payback, and ROIC. It supports questions about operating cost coverage and invested-capital efficiency without equating an EBITDA margin with a cash payback period.
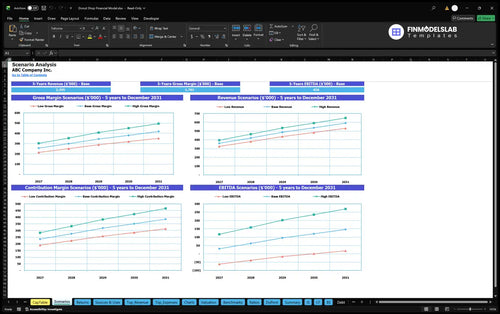
Low, Base, and High controls vary revenue, cost rates, overhead, and payroll. Compare staffing and pricing choices; the annual table is not a tested downside result.
The Financial Scenario Analysis compares Low, Base, and High revenue, gross margin, contribution margin, and EBITDA projections. It helps identify which changes to ticket demand, pricing, expense rates, or staffing assumptions most affect modeled operating performance.
The template is suited to evaluating an independent counter-service donut shop with one physical retail location and a tightly defined paid-basket mix.
Prepare budgets, test order volumes and staff coverage, model cost pressures, and review reports with advisers or financing partners.
The example excludes franchises, wholesale, and marketplace delivery. Shops using these channels must adapt revenue, fees, payment timing, and staffing.
These answers clarify the operating assumptions, workbook functions, and limits of the illustrated financial projections.
Yes. Edit daily paid orders, monthly trading days, basket mix, and annual prices.
Each order belongs to one basket, and coffee is included once in the combo price.
Yes. Payroll separately plans four roles using salaries and FTE.
No. CAPEX and opening cash are separate; asset purchases and depreciation have their own schedules.
Yes. Cash Flow and Balance Sheet reports are included, while illustrated case outputs stop at EBITDA.
Yes. Scenario controls compare Low, Base, and High operating assumptions and profitability.
No. Estimates do not establish net profit, lending eligibility, payback timing, or cash sufficiency.
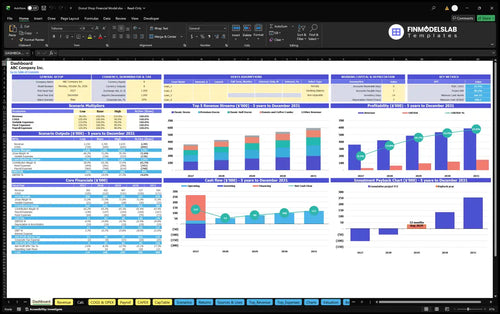
KPIs, forecasts, and cash flow at a glance.
Key assumptions and calculations driving revenue forecasts.
Funding sources, spending, and closing cash.
Cash break-even, payback, and ROIC.
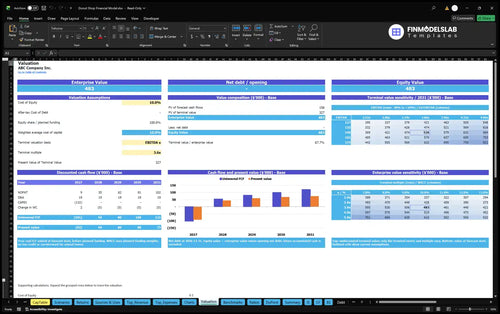
DCF valuation and sensitivity analysis.
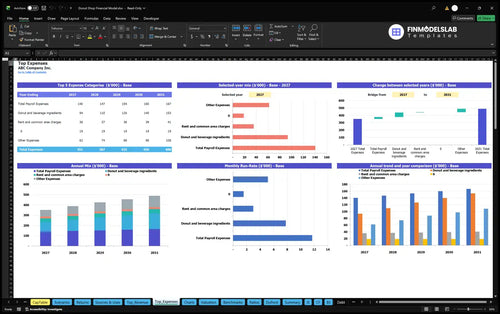
Largest costs and spending trends.
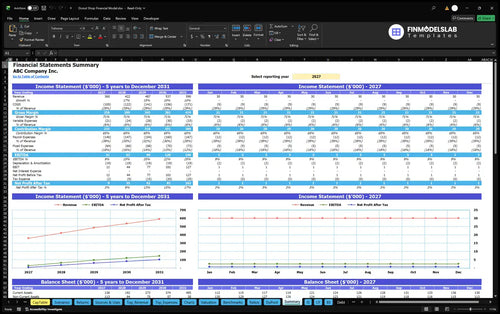
Annual and monthly financial performance.
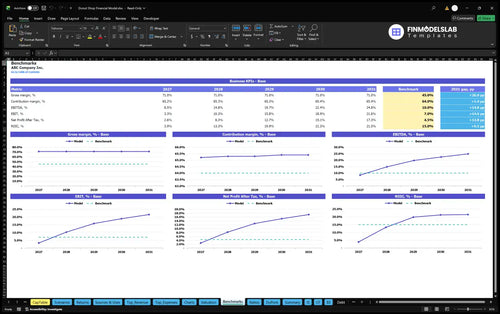
Compare margins and returns to benchmarks.

This template put pricing, costs, and growth in one place, so I stopped chasing numbers across tabs. I cut my planning time by about 4 hours and could explain the assumptions much more clearly.

I could finally see margins and break-even without rebuilding formulas. That saved me a messy afternoon and made my lender call a lot easier to prepare for.
Low, base, and high cases were set up in a way that made comparisons quick instead of tedious. I got through my scenario review in under an hour and booked the next planning meeting the same day.