Esop Administration Financial Model Template in Excel

One pre-built Excel file, ready for ESOP administration planning. Enter your assumptions, and the schedules, forecasts, and summaries are already laid out for cleaner review.
Employee Stock Ownership Plan Administration Financial Model visual header representing the model’s overview, summarizing ESOP structure, participant equity allocations, and admin features to plan ownership and valuation.
Fully Editable
Instant Download
Professional Design
Pre-Built
No Expertise Is Needed
Employee Stock Ownership Plan Administration Financial Model visual header representing the model’s overview, summarizing ESOP structure, participant equity allocations, and admin features to plan ownership and valuation.
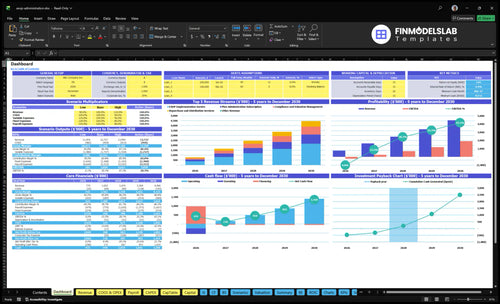
Employee Stock Ownership Plan Administration Financial Model dashboard summarizes key KPIs, equity allocations, cash runway and plan performance with a dynamic dashboard for investor-ready reporting and clarity on cash-flow blind spots
Employee Stock Ownership Plan Administration Financial Model ROIC calculation and charts showing return on invested capital, investor-ready insights into ownership return timing and efficiency with clear drivers and error checks.
Employee Stock Ownership Plan Administration Financial Model break-even calculation and charts showing when revenue/costs align, helping test profitability timing and funding needs to avoid cash-flow blind spots.
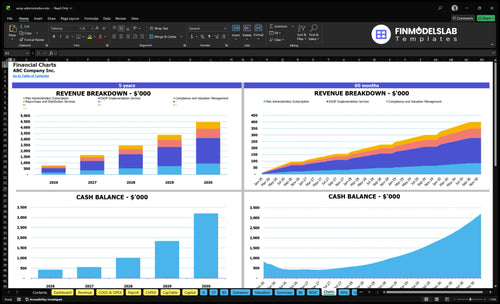
Employee Stock Ownership Plan Administration Financial Model financial charts visualizing equity distribution, expense trends, cash impact and key KPIs for stakeholder reporting and polished investor-ready presentations.
Employee Stock Ownership Plan Administration Financial Model ratios page showing liquidity, profitability, leverage and efficiency metrics to assess ESOP performance and stakeholder returns with clear driver links.
Employee Stock Ownership Plan Administration Financial Model valuation section showing valuation analysis and implied company value to assess ownership dilution, investor-ready outputs and clear return drivers.
Employee Stock Ownership Plan Administration Financial Model revenue inputs letting users customize contribution schedules, revenue drivers, fee assumptions and participant growth for scenario-ready projections and investor-ready outputs
Employee Stock Ownership Plan Administration Financial Model COGS and Opex inputs tab lets users customize operating costs, cost of goods sold drivers, fees and overhead for forecasting and scenario-ready expense planning.
Employee Stock Ownership Plan Administration Financial Model - capex inputs allowing customization of capital expenditures, asset schedules and depreciation assumptions to model funding needs; fully customizable for scenario testing and investor-ready projections
Employee Stock Ownership Plan Administration Financial Model payroll inputs tab showing staffing, salaries, benefits, payroll taxes and timing assumptions; lets users customize headcount, compensation drivers and run scenario-ready cost forecasts.
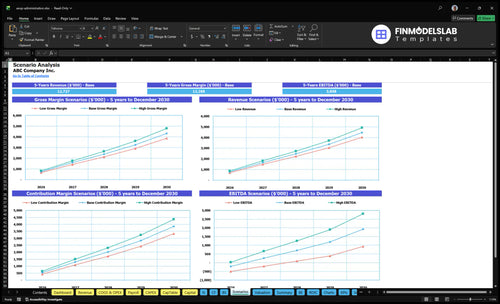
Employee Stock Ownership Plan Administration Financial Model scenario charts comparing low, base and high outcomes to test assumptions, equity dilution and funding needs and fix weak scenario testing.
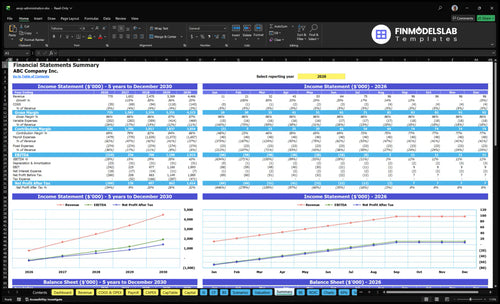
Employee Stock Ownership Plan Administration Financial Model financial summary showing consolidated P&L, cash flow runway and balance sheet snapshot that clarifies funding needs, stakeholder returns and plan affordability, investor-ready formatting
Employee Stock Ownership Plan Administration Financial Model income statement report showing automated P&L projection and profitability trends, delivering clear revenue, expenses and net income for investor-ready financial reviews and cash-flow clarity
Employee Stock Ownership Plan Administration Financial Model cash flow report showing projected cash inflows and outflows, runway and liquidity analysis to identify cash-flow blind spots and support funding decisions.
Employee Stock Ownership Plan Administration Financial Model balance sheet report showing assets, liabilities and equity positions to project company financial position, support investor-ready reporting and clarify ownership impacts on net worth.
Employee Stock Ownership Plan Administration Financial Model top expenses report detailing largest cost categories and staffing-related expenses, helping identify major cost drivers and manage plan administration spend for clearer investor-ready forecasts
Employee Stock Ownership Plan Administration Financial Model top revenue report showing revenue breakdown by source and forecasts, helping identify key income drivers and support investor-ready reporting.
Employee Stock Ownership Plan Administration Financial Model sources and uses report showing funding plan, capital allocation and use of proceeds to map buyouts, contributions and transaction costs for investor clarity and funding decisions
Employee Stock Ownership Plan Administration Financial Model Dupont report showing DuPont decomposition of ROE to clarify profitability drivers, operational leverage and capital efficiency for investor-ready analysis
Employee Stock Ownership Plan Administration Financial Model captable inputs and calculations, letting users enter ownership stakes, option grants, vesting schedules and dilution impacts with customizable, scenario-ready fields for funding and equity planning
Employee Stock Ownership Plan Administration Financial Model KPI charts visualizing ownership distribution, equity vesting, payroll impact and cash metrics for stakeholder reporting and polished investor-ready presentations
Fully Editable
Instant Download
Professional Design
Pre-Built
No Expertise Is Needed
Employee Stock Ownership Plan Administration Bundle
See included products:
Financial Model iEmployee Stock Ownership Plan Administration Bundle Financial Model template included in this product.
$149 $109
ADD TO YOUR ORDER
Business Plan iEmployee Stock Ownership Plan Administration Bundle Business Plan template included in this product.
$79 $59
Pitch Deck iEmployee Stock Ownership Plan Administration Bundle Pitch Deck template included in this product.
$49 $29
YOU SAVE $0 TODAY
30-Day Money-Back Guarantee
Created by a Former CFO
Updated for 2026
One-Time Purchase
Description
MODEL OVERVIEW

What Is the Employee Stock Ownership Plan Administration Financial Model?

It is an editable five-year Excel workbook that forecasts recurring client-fee revenue and connects it to costs, statements, scenarios, and management reports.

Plan customer acquisition, retention, service-tier pricing, operating costs, staffing, capital spending, financing, and cash needs in one structured forecast.

Editable assumptions feed monthly calculations and annual views so changes to customers, fees, costs, or funding flow through the model’s financial outputs.

Built for recurring service revenue Customer cohorts and monthly fees drive revenue before the model rolls results into financial reporting.
RECURRING SERVICE REVENUE

How Does Employee Stock Ownership Plan Administration Revenue Build in the Model?

Revenue starts with marketing-driven customer acquisition, assigns customers across service tiers, retains each cohort for its modeled lifetime, and charges monthly fees.

01

Acquire Customers

New customers equal marketing spend divided by customer acquisition cost.

02

Allocate Tiers

New customers are assigned across service tiers using the entered allocation mix.

03

Retain Cohorts

Starting customers and unexpired acquisition cohorts determine active customers by tier.

04

Apply Monthly Fees

Each tier’s active customers are multiplied by its monthly fee per customer.

05

Calculate Revenue

Monthly tier revenue is summed across all tiers and forecast months.

CORE FORMULA Revenue = Active customers × Monthly fee per customer
01 / REVENUE ASSUMPTIONS

Which Inputs Drive Recurring Client Revenue?

The Revenue Assumptions sheet connects launch timing, marketing spend, CAC, customer allocation, cohort lifetime, and monthly service fees to active-customer growth.

Revenue Assumptions worksheet for Employee Stock Ownership Plan Administration showing acquisition, customer allocation, lifetimes, and monthly fees REVENUE ASSUMPTIONS
Revenue Assumptions displays acquisition, allocation, customer lifetime, and monthly fee inputs.
02 / COGS & OPEX

How Are Service Costs and Operating Expenses Planned?

The COGS & OPEX sheet separates direct service costs, variable expenses, and fixed overhead so operating assumptions flow into the forecast.

COGS and OPEX worksheet for Employee Stock Ownership Plan Administration showing direct costs, variable expenses, and fixed operating expenses COGS & OPEX
COGS & OPEX separates direct, variable, and fixed operating expense assumptions.
03 / SCENARIO ANALYSIS

How Do Low, Base, and High Cases Compare?

The Scenario Analysis view compares revenue, gross margin, contribution margin, and EBITDA trajectories across Low, Base, and High cases.

Scenario Analysis worksheet for Employee Stock Ownership Plan Administration comparing Low, Base, and High revenue and profitability outcomes SCENARIO ANALYSIS
Scenario Analysis charts compare revenue and profitability measures across three cases.
04 / DASHBOARD

What Does the Dashboard Bring Together?

The Dashboard combines model setup, scenario controls, core financials, revenue mix, profitability, cash flow, and investment payback into one management view.

Dashboard for Employee Stock Ownership Plan Administration showing setup controls, scenario outputs, revenue mix, profitability, cash flow, and payback charts DASHBOARD
Dashboard combines setup controls, scenario outputs, core financials, cash flow, and payback charts.
PRODUCT FIT

Is the Employee Stock Ownership Plan Administration Financial Model Right for You?

The model fits recurring service businesses with cohort-based customer revenue; materially different billing logic, operating schedules, or reporting may call for custom modeling.

READY-MADE MODEL

A Good Fit

  • You charge active corporate clients recurring monthly fees across defined service tiers.
  • Customer growth is driven by marketing spend, CAC, and a tier allocation mix.
  • Retention can be represented through customer lifetimes or the workbook’s churn convention.
  • You need a five-year plan linking revenue, costs, staffing, cash flow, and scenarios.
CUSTOM STRUCTURE

Consider Custom Modeling

  • Your revenue depends on transaction values, hourly billing, commissions, or another materially different formula.
  • Customer contracts require bespoke renewal, expansion, or retention mechanics beyond the model’s cohort structure.
  • You need additional operating schedules that materially change how revenue or costs are calculated.
  • You require reporting outputs or financial logic outside the ready-made workbook structure.

The template is a planning starting point, not a guarantee of performance.

CUSTOM FINANCIAL MODELING SERVICE

Need a Model Built Around Your Requirements?

Financial Models Lab can build or adapt a model when your revenue logic, operating schedules, or reporting requirements differ from the ready-made structure.

ORDER A CUSTOM FINANCIAL MODEL
AFTER CHECKOUT

What You Receive

After checkout, you receive an editable downloadable Excel model with a five-year forecast, scenario analysis, and integrated financial reporting.

01

Editable workbook

Enter your own customer, pricing, cost, staffing, capital, and financing assumptions.

02

Five-year forecast

Review the plan across the model’s five-year projection horizon.

03

Scenario analysis

Compare Low, Base, and High cases using the workbook’s scenario controls.

04

Financial reports

Review projected statements, ratios, KPIs, charts, and decision-oriented reports.

BEFORE YOU BUY

Employee Stock Ownership Plan Administration Financial Model FAQ

The essential answers are visible in full, with no accordion clicks required.

01

How does the model calculate Employee Stock Ownership Plan Administration revenue?

It multiplies active customers in each service tier by the monthly fee per customer, then sums tiers and months. Customer acquisition, allocation, and retention determine the active customer base.

02

Which assumptions can I change?

You can change the launch date, starting customers, marketing budget and seasonality, CAC, tier allocation, customer lifetime or churn convention, and monthly fees by tier.

03

What can I compare in the Low, Base, and High scenarios?

The Scenario Analysis view compares revenue, gross margin, contribution margin, and EBITDA paths across the three cases. Scenario controls show how alternative assumptions change projected results.

04

Which financial outputs are included?

Confirmed outputs include the income statement, cash flow statement, balance sheet, Dashboard, Scenarios, Summary, Break-Even, ROIC, Charts, KPIs, Ratios, Valuation, Sources & Uses, DuPont, Top Revenue, and Top Expenses.

05

Can Financial Models Lab adapt the model to custom requirements?

Yes. Custom financial modeling can address different revenue logic, operating schedules, or reporting requirements when the ready-made structure does not match your needs.

06

Is the workbook a forecast or a guarantee?

It is a planning forecast driven by the assumptions entered into the workbook, not a guarantee of business performance, profitability, funding, or returns.

What Does the Employee Stock Ownership Plan Administration Financial Model Contain?

This comprehensive ESOP administration Excel template includes everything you need to build a complete financial plan, from initial setup costs to a five-year exit valuation.

esop administration financial model dashboard financialmodelslab

All-in-one Dashboard

Core inputs and core outputs

esop administration financial model scenarios financialmodelslab

Low/Base/High

Three scenario analysis

esop administration financial model charts financialmodelslab

Professional Charts

Presentation ready

esop administration financial model dupont financialmodelslab

ROE Components

DuPont analysis

esop administration financial model revenue financialmodelslab

Revenue Inputs

Researched revenue assumptions

esop administration financial model summary financialmodelslab

Bank-Ready Reports

Lender-friendly financial outputs

esop administration financial model top revenue financialmodelslab

Revenue Breakdown

Revenue stream detailed view

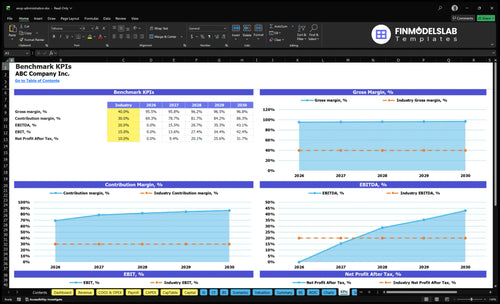
esop administration financial model kpis financialmodelslab

KPI Dashboard

Performance metrics benchmark

Trusted by 25,000+ startup founders, investors and CPAs

Less Technical, Easier To Use

Megan Turner, TX

4 star rating

I’m not strong in Excel, so the pre-built ESOP admin model made the setup feel manageable instead of overwhelming. It saved me about 6 hours I would’ve spent trying to figure out advanced formulas.

Fewer Formula Mistakes

Derek Collins, OH

4 star rating

One broken cell used to make me second-guess every number, but this template kept the calculations organized and easy to trace. I caught an issue in minutes instead of spending half a day fixing a tangled sheet.

Started Without The Blank Page

Lauren Mitchell, NC

4 star rating

I kept putting off the model because starting from scratch felt like a lot. This template gave me a clear place to begin, and I had a working draft ready the same afternoon.