

Acquire Customers
Monthly marketing spend divided by CAC determines new customers.


It is an editable five-year workbook for forecasting client cohorts, billable flagging hours, costs, scenarios, and linked financial statements.
Use the model to translate marketing activity, client retention, service mix, billable hours, and hourly rates into a structured operating forecast.
Editable assumptions feed monthly calculations and then flow into scenario views, the dashboard, and the income statement, cash flow, and balance sheet.
The model acquires customers through marketing, retains cohorts by lifetime, calculates active-client billable hours, and applies hourly rates by service tier.
Monthly marketing spend divided by CAC determines new customers.
New customers are distributed across service tiers using editable allocation percentages.
Starting customers and unexpired cohorts determine active customers by tier.
Active customers multiplied by average monthly billable hours produce tier hours.
Billable hours multiplied by hourly rates create monthly revenue across service tiers.
The Revenue Assumptions view connects marketing budgets, CAC, service allocation, customer lifetime, billable hours, and hourly pricing to the client forecast.
 REVENUE ASSUMPTIONS
The COGS & Operational Expenses worksheet separates direct cost assumptions, variable expenses, and fixed operating spending across forecast periods.
 COGS & OPERATIONAL EXPENSES
The Scenario Analysis view compares revenue, gross margin, contribution margin, and EBITDA trajectories across Low, Base, and High assumptions.
 SCENARIO ANALYSIS
The Dashboard combines setup controls, scenario outputs, core financials, revenue mix, profitability, cash flow, and investment payback charts.
 DASHBOARD
It fits service businesses using client cohorts, billable hours, and hourly rates; materially different revenue mechanics may require custom structure.
The template is a planning starting point, not a guarantee of performance.
Financial Models Lab can build or adapt a model when you need different revenue logic, operating schedules, or reporting structures.
ORDER A CUSTOM FINANCIAL MODELYou receive an instantly downloadable, editable Excel or Google Sheets model with five-year projections, scenarios, dashboard views, and linked financial statements.
Open and edit the model in Excel or Google Sheets.
Plan monthly and annual operating and financial results across five years.
Compare Low, Base, and High cases across key forecast outcomes.
Review linked income statement, cash flow, balance sheet, dashboard, and summary outputs.
The essential answers are visible in full, with no accordion clicks required.
It calculates new customers from marketing spend and CAC, retains client cohorts, multiplies active customers by billable hours, and applies hourly rates by tier.
You can edit launch timing, starting customers, marketing budget and seasonality, CAC, tier allocation, customer lifetime, billable hours, and hourly rates.
It compares revenue, gross margin, contribution margin, and EBITDA trajectories across Low, Base, and High cases.
The product shows a Dashboard plus linked income statement, cash flow statement, balance sheet, Summary, and other management reports.
Yes. Financial Models Lab offers custom financial modeling for different revenue logic, operating schedules, or reporting structures.
It is a planning forecast based on editable assumptions, not a guarantee of business performance or financial results.
This financial model for a new traffic control business provides a complete toolkit in both Excel and Google Sheets, featuring a dynamic dashboard, 5-year financial statements, and detailed tabs for all your assumptions.
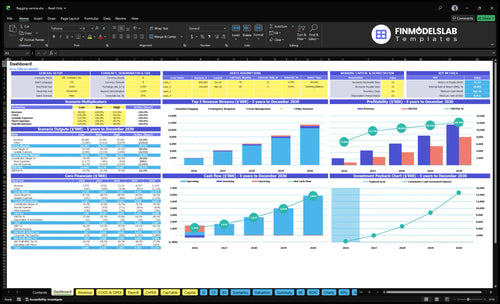
Core inputs and core outputs
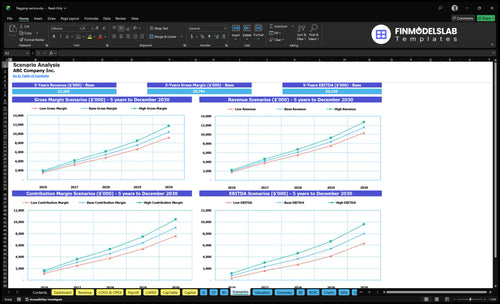
Three scenario analysis
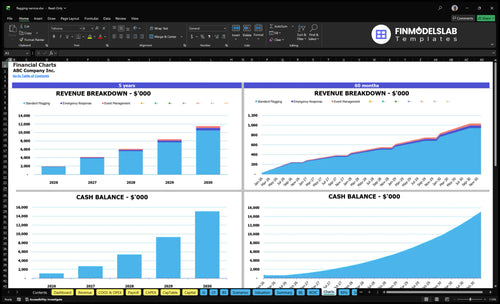
Presentation ready
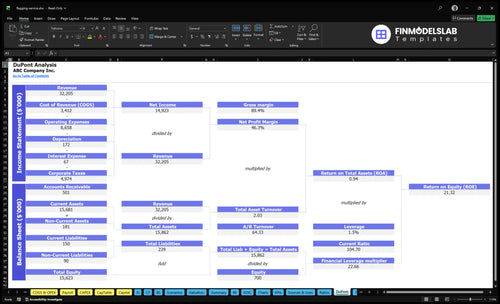
DuPont analysis
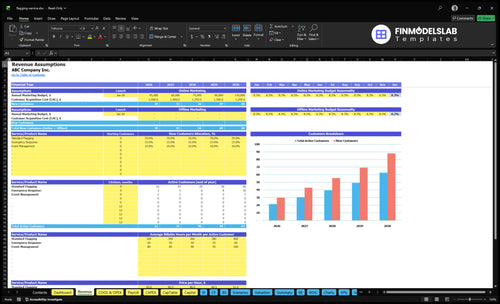
Researched revenue assumptions
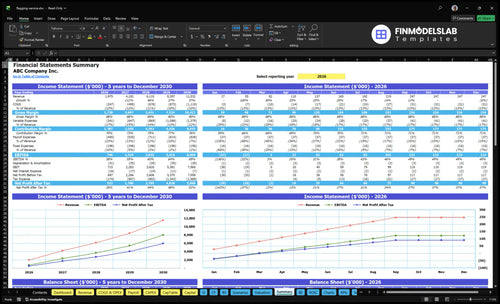
Lender-friendly financial outputs
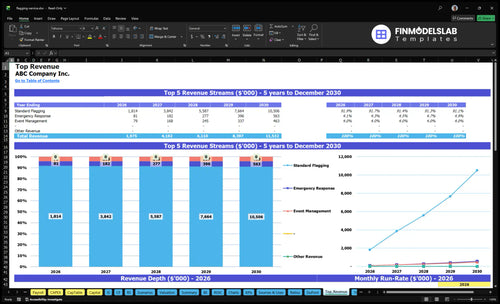
Revenue stream detailed view
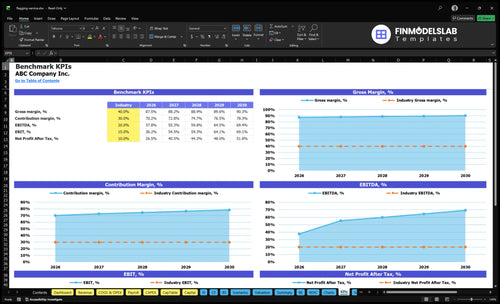
Performance metrics benchmark

I finally pulled statements and charts into one place, so I spent less time hunting through files and more time reviewing the numbers. That cut my weekly reporting prep by about 4 hours.
One broken cell used to throw off my whole model, and I was always second-guessing the totals. With this template, I caught issues faster and saved nearly a full day of rework.
Pricing, labor, and growth assumptions were spread everywhere before, but now they’re laid out clearly in one tab. It made planning a lot easier and helped me walk into a client meeting with cleaner numbers.