

Revenue and Calc
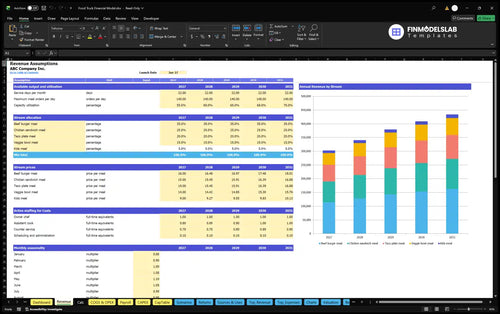
Set capacity, utilization, seasonality, five meal prices, and mix; Calc forecasts monthly sales.


The Food Truck Financial Model projects an owner-operated Austin grill truck’s meal orders, revenue, and operating results for 2026–2030. Sales are driven by capacity, utilization, seasonality, meal prices, and menu mix.
The example uses one truck, a four-hour selling window, 22 service days per month, and capacity for 140 meals daily. Sales are direct and paid at order; alcohol, marketplace delivery, and invoiced catering are excluded.
The workbook links truck operating assumptions to monthly forecasts, statements, and investment reports.
Set capacity, utilization, seasonality, five meal prices, and mix; Calc forecasts monthly sales.
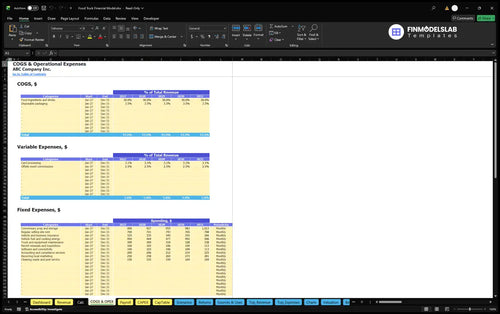
Model food, packaging, sales fees, fixed overhead, FTE, and base salaries.
Set working-capital days and Low, Base, and High sales and cost multipliers.
Review profitability, cash movements, and financial position as distinct measures.
Review purchases, financing, break-even, and investment analysis in dedicated schedules.
One pool of sold meals is assigned across five menu baskets and multiplied by prices.
The volume calculation uses 22 selling days × 140 maximum meals per day × annual capacity utilization × the month’s seasonal multiplier. Utilization moves from 55% in 2026 to 70% in 2030; staffing levels support the truck but do not create a second sales forecast.
The meal mix assigns 35% of sales to beef burger meals, 25% to chicken sandwiches, 20% to taco plates, 15% to veggie bowls, and 5% to kids meals. Each sold meal belongs to one category, so revenue is not double-counted.
The Revenue Forecast converts truck capacity, utilization, seasonal demand, menu mix, and prices into monthly units and sales by offering. It helps test sales capacity and the assumed ticket prices.
22 days/month × 140 meals/day × 55% utilization × 12 seasonal-equivalent months × $14.90 blended meal price ≈ $302,887 annual revenue.
The $14.90 blended 2026 price is weighted by menu shares, not an extra product line. Monthly seasonal factors total twelve equivalent months.
Beef burger meals start at $16 and kids meals at $9. Changing a meal price affects only orders allocated to that basket.
Costs are separated into direct, variable, fixed, and payroll categories.
Ingredients and drinks cost 30% of revenue, packaging 3.5%, processing 3.1%, and offsite commissions 2.5% in this example.
Fixed monthly spending includes commissary, site rent, insurance, fuel, maintenance, permits, software, accounting, marketing, and cleaning. Commissary costs begin at $900 monthly.
The COGS and Operating Expenses forecast separates ingredient and packaging costs, processing fees, commissions, and fixed overhead. Compare these categories to identify cost pressure as sales grow.
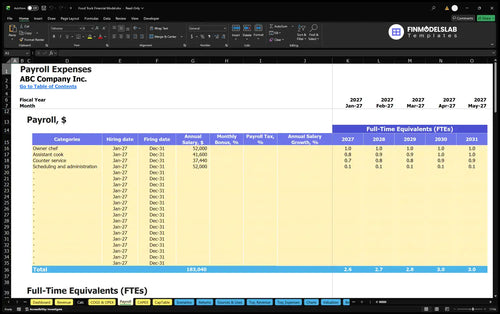
Average staffing increases from 2.6 FTE in 2026 to 3.0 in 2030. The initial mix is 1.0 owner-chef, 0.8 assistant, 0.7 counter-service, and 0.1 administrative FTE.
The Payroll Forecast links FTE and annual base salary by role to monthly personnel costs. The owner-chef assumption is $52,000 annually per FTE, with different pay rates for supporting roles.
| Cost category | 2026 | 2030 |
|---|---|---|
| COGS | $101,467 | $145,348 |
| Variable expenses | $16,962 | $24,297 |
| Fixed expenses | $41,700 | $46,934 |
| Payroll | $116,688 | $132,496 |
Illustrative model amounts, rounded to whole dollars. Small differences from displayed totals may arise from rounding.
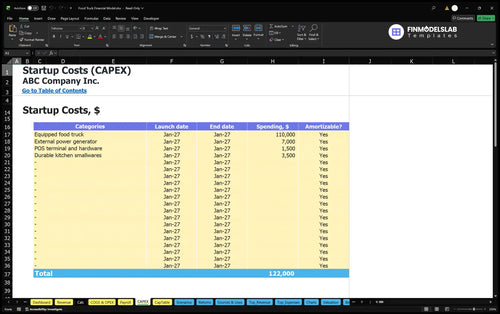
Equipment, preopening cash, working capital, and owner funding are separate from operating expenses.
Planned assets total $122,000: truck $110,000, generator $7,000, POS hardware $1,500, and smallwares $3,500. Setup, registration, deposits, prelaunch payroll, and marketing are separate cash items.
The Capital Expenditure Plan schedules truck and equipment purchases and their depreciation. Durable asset investment is distinct from the recurring costs used to derive operating EBITDA.
Owner funding is estimated at $201,451, with no confirmed external financing. The estimate includes assets, preopening cash, working capital, and a three-month first-year cash reserve.
Working-capital assumptions are zero receivable days, three payable days, and six inventory days. They affect cash planning but do not establish funding sufficiency.
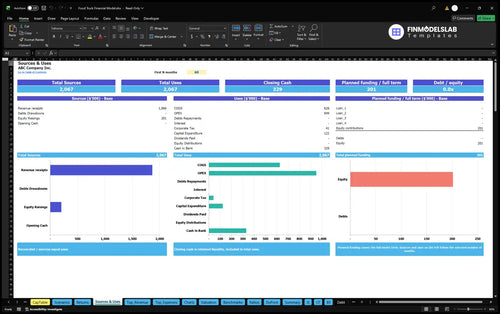
Sources and Uses of Funds organizes owner contributions, financing, and cash allocation across operations and investment. Compare launch funding against the planned uses and cash requirements.
The illustrative base case forecasts annual revenue, expenses, and EBITDA in USD.
| Year | Revenue | Operating expenses | EBITDA |
|---|---|---|---|
| 2026 | $302,887 | $276,817 | $26,070 |
| 2027 | $340,335 | $296,662 | $43,673 |
| 2028 | $379,675 | $317,284 | $62,391 |
| 2029 | $409,162 | $336,173 | $72,989 |
| 2030 | $433,873 | $349,074 | $84,799 |
Illustrative case forecasts, not actual historical performance or industry averages. Values are rounded to the nearest whole dollar.
As utilization rises from 55% to 70% and prices increase, projected EBITDA grows from $26,070 in 2026 to $84,799 in 2030.
EBITDA excludes depreciation, interest, and tax. The documented scenario does not establish net profit, balance-sheet, or cash-flow amounts.
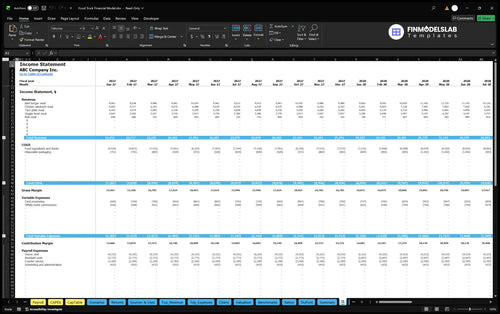
The Projected Income Statement presents sales, operating costs, and EBITDA, followed by depreciation, interest, and tax. Use it to assess accounting profit separately from the supplied EBITDA projections.
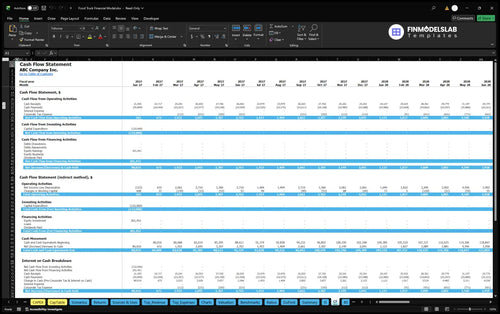
Direct payment means no modeled invoice receivables, but inventory, supplier payments, equipment purchases, and financing still affect liquidity. EBITDA does not establish monthly cash sufficiency.
The Cash Flow Forecast separates operating, investing, and financing cash movements and reconciles closing cash. It helps test liquidity after purchases and financing rather than relying on EBITDA.
Returns and scenario reports support operating, investment, and sensitivity decisions.
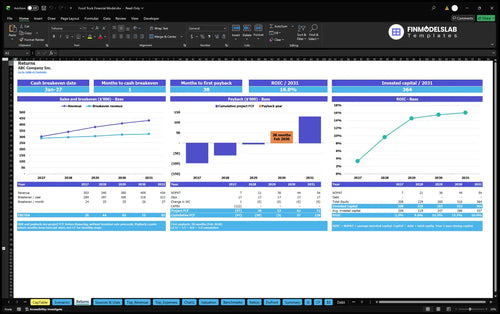
Sales break-even tests operating cost coverage; cash break-even measures cash timing. Payback follows cumulative investment cash flows, while annual ROIC compares returns with invested capital.
The Returns report analyzes sales break-even, cash break-even, investment payback, and ROIC separately. The supplied EBITDA values do not establish a payback month or invested-capital return.
Dashboard controls apply Low, Base, and High multipliers to revenue, COGS, variable costs, fixed costs, and payroll to test operating sensitivity.
Financial Scenario Analysis compares Low, Base, and High revenue, gross margin, contribution margin, and EBITDA. No quantified downside or upside outcome is established by the supplied case.
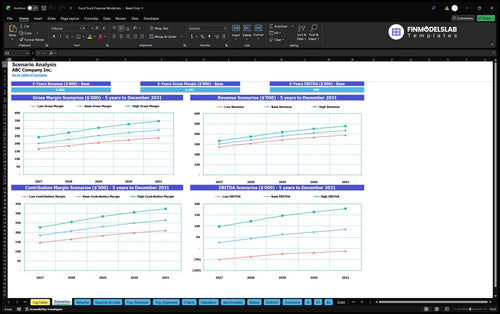
Designed for a single food truck assessing prices, throughput, staff, and funding.
Edit utilization, prices, mix, staff, costs, and startup assets to evaluate margins and financing needs. Use Checks and management reports to review the plan.
Adapt this Austin direct-pay example for other hours, menus, events, or locations; its assumptions are estimates rather than verified local averages.
Answers about editing assumptions, interpreting the projections, and using the workbook reports.
Yes. Edit realized prices and the five meal shares in Revenue; those shares allocate one total pool of sold meals and should add to 100%.
No. Staffing is a payroll cost assumption in this case; sales are calculated from daily meal capacity, service days, utilization, seasonality, and meal prices.
No. The illustrated operation covers five complete meal baskets sold directly at order, without alcohol, invoiced catering, or delivery marketplace revenue.
Yes. The standard workbook declares Cash Flow and Balance Sheet reports, but the supplied example only establishes numerical operating results through EBITDA.
No. The $201,451 owner-funding figure is an estimated planning input, not a validated cash sufficiency test or confirmation of outside financing.
No. EBITDA excludes depreciation, interest, tax, and the cash effects of investment and financing; review the relevant financial statements separately.
Yes. Dashboard controls support Low, Base, and High multipliers for revenue and major cost groups; the provided case does not establish numerical results for those alternatives.
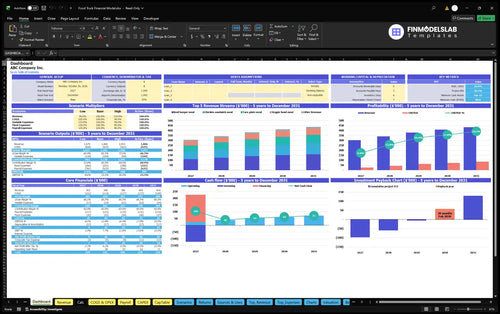
KPIs, forecasts, and cash flow at a glance.
Key assumptions and calculations driving revenue forecasts.
Funding sources, spending, and closing cash.
Cash break-even, payback, and ROIC.
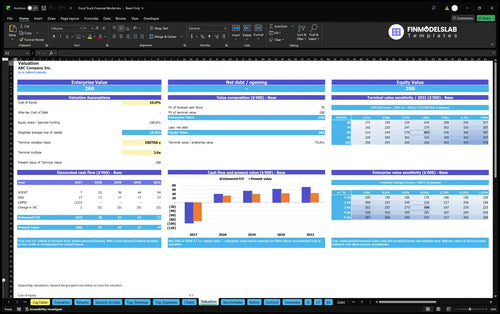
DCF valuation and sensitivity analysis.
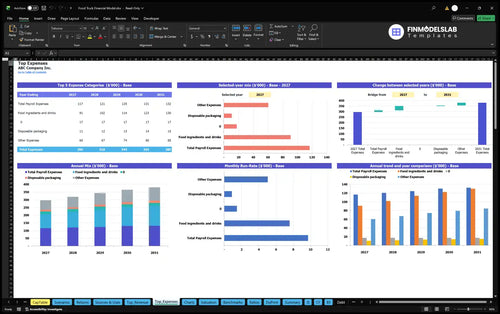
Largest costs and spending trends.
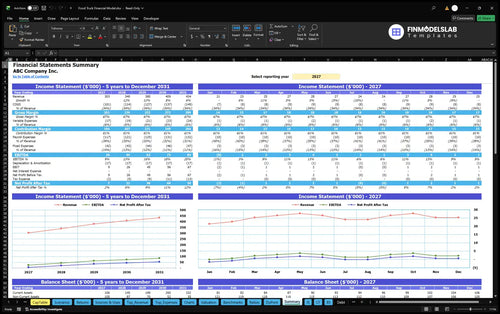
Annual and monthly financial performance.
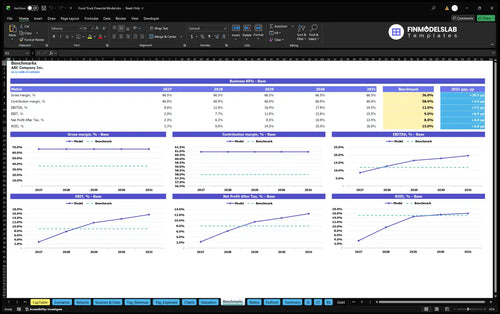
Compare margins and returns to benchmarks.

The template got me past the empty-spreadsheet stage in one sitting, so I could move from idea to a working draft without second-guessing every row.

I was worried one bad formula would throw off the whole model, but the structure kept everything clear and easy to check. I finished my review in under an hour instead of spending a day hunting errors.
Building the numbers by hand would have taken me most of a week, and this template cut that down to a few hours. I had a clean forecast ready for my meeting the same day.