

Revenue & Calc
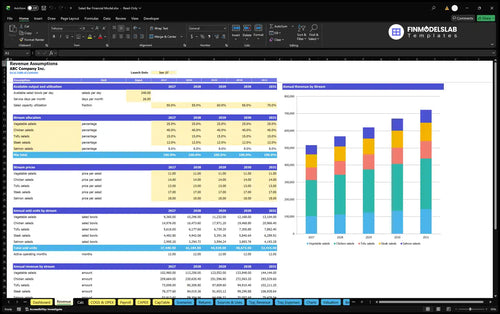
Set bowl capacity, utilization, protein mix and prices; calculate monthly category volumes and total revenue.


The Salad Bar Financial Model is an editable Excel template for a build-your-own salad counter, linking bowl capacity, protein mix, costs, staffing and startup capital to a five-year forecast.
The illustrated business is a leased 1,500-square-foot unit near Indianapolis, open six days weekly. Only one salad bowl per sale counts; beverages, delivery, catering and add-ons are excluded.
Connected operating schedules and financial reports let you trace each input from salad sales through funding and performance analysis.
Set bowl capacity, utilization, protein mix and prices; calculate monthly category volumes and total revenue.
Set food and packaging rates, transaction charges, promotions, rent and other overhead.
Plan staff FTE and salaries; schedule equipment, improvements and depreciation separately.
Use equity, debt, three financial statements and Sources & Uses reports for financing and operating analysis.
Review scenarios, returns, valuation, benchmarks and reconciliation checks; no result is guaranteed.
Revenue equals one shared bowl-output capacity multiplied by utilization and the sales-weighted price of the five salad categories.
Daily capacity is 240 bowls, or 6,240 monthly across 26 service days. At 50% utilization, the 2026 model sells 3,120 bowls monthly and 37,440 annually.
Each sale belongs to one category: vegetable (25%, $11); chicken (40%, $14); tofu (15%, $13); steak (12%, $17); salmon (8%, $18). This 100% mix yields a $13.78 weighted bowl price.
The Revenue Forecast combines available capacity, service days, utilization, menu prices and protein mix. Monthly calculations assign every sold bowl to one category, avoiding five independent demand forecasts.
240 bowls/day × 26 days/month × 50% utilization × 12 months × $13.78 weighted price = $515,923.
The selected January 31, 2026 launch date activates every bowl category for the full January month; earlier months would be zero.
Utilization increases annually to 55%, 60%, 65% and 70% through 2030. With prices and mix unchanged, forecast growth comes solely from more bowls sold.
The operating forecast distinguishes direct salad costs, revenue-linked expenses, fixed monthly commitments and salaried staffing to avoid double counting.
Ingredients and proteins are 32% of sales; packaging and sanitation add 2.5%, giving 34.5% COGS. Payment processing (3%) and promotions (1%) comprise a separate 4% variable expense rate.
The COGS and Operating Expenses report separates food, packaging, transaction fees, promotions and overhead. Change the inputs to assess gross and contribution margins.
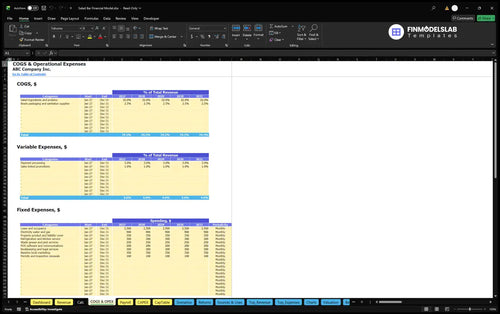
Annual fixed costs are $75,000, including $3,500 monthly occupancy. Other lines cover utilities, insurance, servicing, waste, software, professional services, marketing and permits.
The Payroll Forecast budgets positions, staffing FTE and salaries. This case includes base salaries there, rather than double counting them as COGS or variable costs.
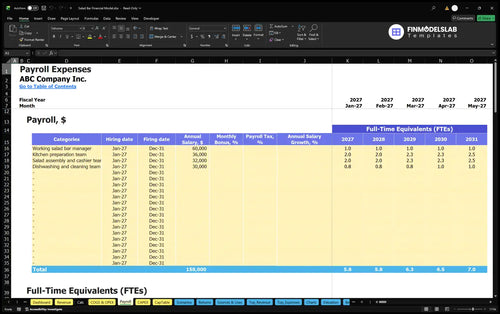
In 2026, staffing comprises a working manager at $60,000, two prep FTE at $36,000 each, two assembly FTE at $32,000 each and 0.75 cleaning FTE at $30,000 per FTE. Total base payroll is $218,500.
By 2030, prep and assembly each reach 2.5 FTE, cleaning reaches 1 FTE, and payroll rises to $260,000. Employer taxes and benefits are excluded from this case.
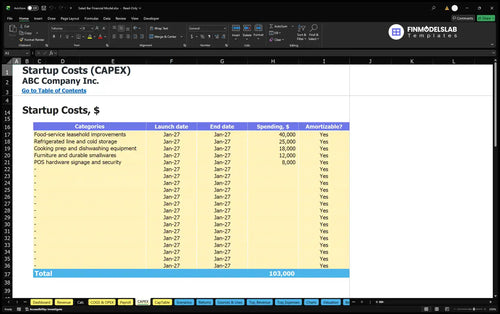
Opening asset purchases, prelaunch cash outlays and capital contributions are tracked separately from recurring operating earnings.
Four startup assets total $95,000: leasehold improvements ($40,000), refrigeration ($25,000), preparation equipment ($18,000), and furniture and smallwares ($12,000). Additional POS hardware, signage and security have no amounts in this brief.
The Capital Expenditure Plan schedules durable restaurant purchases and depreciation, distinguishing opening assets from the recurring expense rates that determine EBITDA.
Preopening cash needs include deposits, permits, registrations, marketing, training and wages. Working-capital inputs are zero receivable days, seven payable days and four inventory days; they change cash timing, not EBITDA.
The Sources and Uses of Funds report compares equity, potential debt and cash receipts with operating, investing and financing payments, clarifying the allocation of available funding.
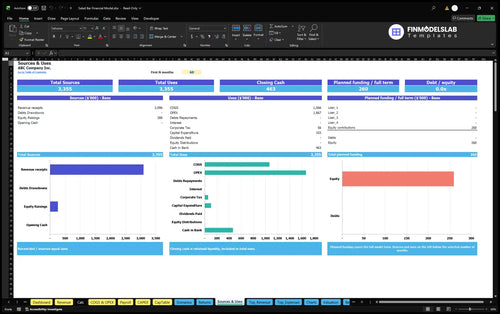
Estimated owner funding of $259,570 covers startup assets, preopening cash, working capital and three months of first-year recurring operating outflows. This reserve is not committed external financing or a tested peak cash requirement.
Higher utilization increases sales over the five-year example, while direct costs, overhead and payroll determine the remaining operating EBITDA.
| Year | Revenue | Operating Expenses | EBITDA |
|---|---|---|---|
| 2026 | $515,923 | $492,130 | $23,793 |
| 2027 | $567,516 | $511,993 | $55,522 |
| 2028 | $619,108 | $548,857 | $70,251 |
| 2029 | $670,700 | $576,220 | $94,481 |
| 2030 | $722,292 | $613,083 | $109,210 |
Illustrative planning results, rounded to whole dollars; totals may differ slightly because of rounding.
In 2026, $515,923 sales minus $492,130 expenses yields approximately $23,793 EBITDA. At 70% utilization in 2030, revenue reaches $722,292, expenses $613,083 and EBITDA $109,210.
EBITDA is not net profit or distributable cash; depreciation, interest and taxes are excluded. Review food waste and ingredient assumptions rather than treat illustrative projections as observed returns.
The Cash Flow Forecast tracks monthly operating, investing and financing flows, including inventory and payable timing. Use it to review liquidity separately from EBITDA.
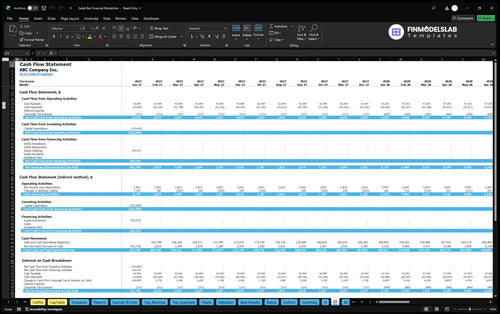
The Income Statement, Balance Sheet and Summary extend reporting beyond these operating results. The brief supplies no net profit, cash balance or debt outcome.
The workbook provides distinct analyses for operating break-even, cash break-even, investment recovery, capital efficiency and scenario changes.
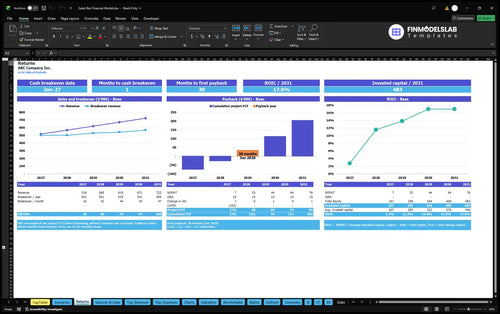
Sales break-even tests revenue needed to cover costs; cash break-even assesses receipt and payment timing. Payback tracks cumulative project cash recovery, while annual ROIC compares returns with invested capital. EBITDA alone establishes none of these.
The Returns analysis covers sales break-even, cash break-even timing, investment payback and annual ROIC. The sample provides no numerical payback or ROIC result.
Dashboard Scenario Controls set Low, Base and High multipliers for revenue and costs. Four debt-control rows accept financing terms, but no borrowing is committed in this case.
Valuation, benchmarks, financial ratios and model checks add analysis without guaranteeing returns or validating local demand.
This financial model is designed for founders, restaurant managers and advisors evaluating a focused counter-service salad concept.
Edit capacity, utilization, menu prices, protein mix, staffing, costs and opening budgets. The Indianapolis example has no verified lease, supplier approval or local demand study.
Beverages, catering, delivery, multiple proteins and separately sold extras would need additional modeling; none appears in this sales structure.
Answers cover editing, salad capacity, excluded sales, staffing, opening funds and interpreting the model reports.
Yes. You can change sales capacity, salad mix and prices, operating expenses, staffing, asset purchases and financing assumptions.
The model multiplies 240 available daily bowls by 26 service days and annual utilization, then allocates sold bowls among five primary-protein categories.
No. The case includes one salad bowl per order and excludes beverages, catering, delivery platforms and separately priced add-ons.
Yes. One working salad bar manager is included in Payroll at a $60,000 annual base salary.
No. It is estimated owner funding with a three-month operating reserve, not a tested maximum funding requirement or financing commitment.
No. EBITDA excludes depreciation, interest and taxes, and it does not capture investing or financing cash movements.
Yes. The Dashboard offers Low, Base and High scenario multipliers for revenue, direct costs, operating expenses and payroll.
No. The Returns worksheet supports payback, break-even and ROIC analysis, but numerical results for those measures are not given in the case brief.
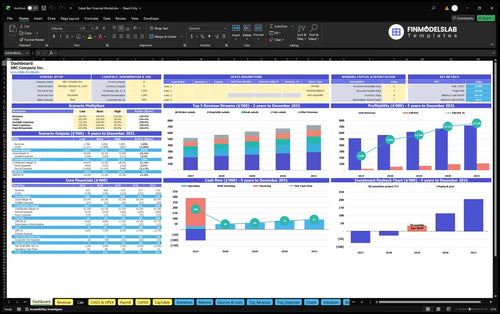
KPIs, forecasts, and cash flow at a glance.
Key assumptions and calculations driving revenue forecasts.
Funding sources, spending, and closing cash.
Cash break-even, payback, and ROIC.
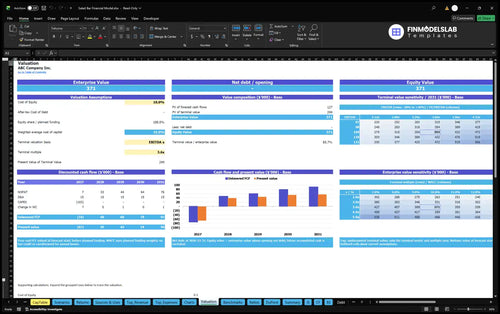
DCF valuation and sensitivity analysis.
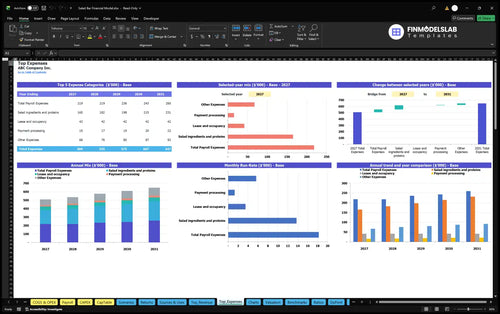
Largest costs and spending trends.
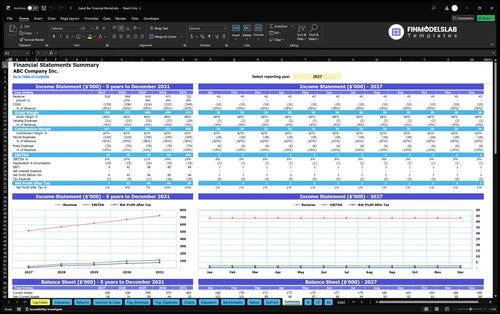
Annual and monthly financial performance.
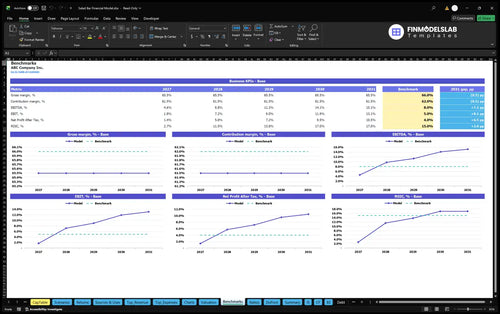
Compare margins and returns to benchmarks.

I didn’t know where to begin, and this saved me from staring at a blank sheet for hours. I had a usable salad bar model in one afternoon instead of wasting a whole weekend.

One broken formula can ruin a forecast, and this template kept that from happening. The checks and built-in structure helped me spot issues fast and prep numbers for a lender meeting without reworking the file.
Pricing, labor, and food costs were all over the place before this model. Now everything sits in one organized file, and I got our first draft forecast cleaned up in less than two hours.