

Forecast Covers
Enter average covers or orders for each weekday across the forecast years.


This editable five-year workbook forecasts a fusion food truck from weekday covers, monthly seasonality, and average checks through financial statements, scenarios, and management reporting.
Use the workbook to plan fusion food truck traffic, average spending, revenue mix, operating costs, staffing, capital investment, funding, and cash requirements in one forecast.
Editable operating assumptions feed the monthly calculation engine, which rolls results into annual statements, scenario comparisons, dashboards, and other decision-oriented reports.
The model turns weekday cover assumptions into monthly seasonally adjusted volumes, applies midweek or weekend checks, allocates sales mix, and totals category revenue.
Enter average covers or orders for each weekday across the forecast years.
Convert the weekday pattern through operating days, weeks, and the opening calendar.
Apply monthly seasonality factors to the resulting monthly cover volume.
Multiply covers by relevant checks and allocate sales across revenue categories.
Sum monthly category sales and separately modeled ancillary sales into total revenue.
The Revenue Assumptions view organizes the opening calendar, weekday covers, seasonality, midweek and weekend checks, and product-category sales mix.
 REVENUE ASSUMPTIONS
The COGS & Operational Expenses view separates direct costs, variable expenses, and recurring fixed spending so operating assumptions flow into the forecast.
 COGS & OPERATIONAL EXPENSES
The Scenario Analysis view compares Low, Base, and High trajectories for revenue, gross margin, contribution margin, and EBITDA across the five-year forecast.
 SCENARIO ANALYSIS
The Dashboard combines model setup, scenario controls, core financial outputs, revenue mix, profitability, cash flow, and investment payback in one management view.
 DASHBOARD
The ready-made model fits a fusion food truck using shared covers-and-check logic; different revenue engines or reporting structures may require custom modeling.
The template is a planning starting point, not a guarantee of performance.
Financial Models Lab can build or adapt a workbook when your business needs different revenue logic, operating schedules, or financial reporting.
ORDER A CUSTOM FINANCIAL MODELAfter checkout, you receive the editable financial model as an instant download with five-year projections, scenarios, statements, and management reports.
Work in the fully editable Excel and Google Sheets compatible financial model.
Plan five years of projections with monthly and annual financial detail.
Compare Low, Base, and High cases using the workbook scenario structure.
Review P&L, cash flow, balance sheet, dashboard, summary, and supporting reports.
The essential answers are visible in full, with no accordion clicks required.
It forecasts weekday covers, converts them through the operating calendar, applies monthly seasonality, uses midweek or weekend checks, allocates category mix, and totals monthly sales.
You can edit the opening date, weekday covers, operating days and weeks, closure calendar, monthly seasonality, average checks, revenue mix, and ancillary sales assumptions.
You can compare Low, Base, and High paths for revenue, gross margin, contribution margin, and EBITDA across the five-year forecast.
The product shows P&L, cash flow, balance sheet, dashboard, summary, break-even, ROIC, valuation, charts, KPIs, ratios, and other supporting reports.
Yes. Financial Models Lab can build or adapt the model when you need different revenue logic, operating schedules, or reporting.
It is a planning forecast based on the assumptions you enter, not a guarantee of business performance or financial results.
Get immediate access to a complete, five-year food truck financial model in Excel and Google Sheets, including detailed financial statements, a dynamic dashboard, and a comprehensive breakdown of all necessary assumptions.
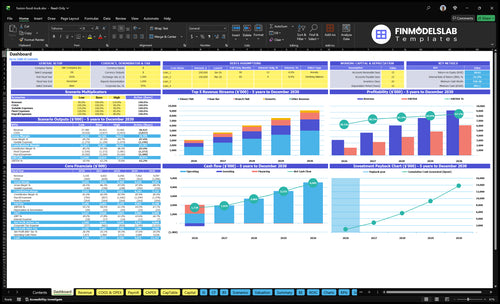
Core inputs and core outputs
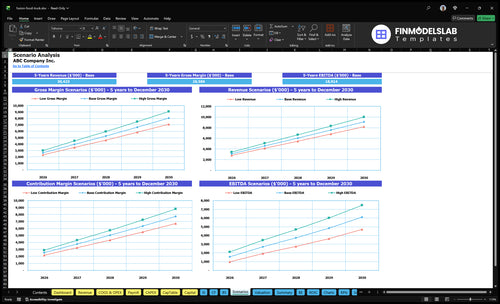
Three scenario analysis
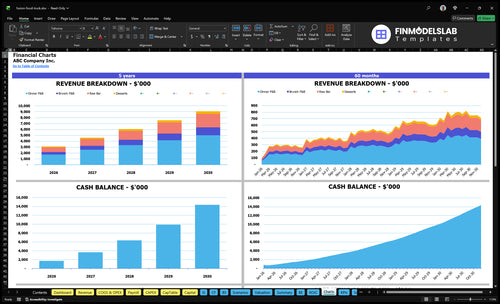
Presentation ready
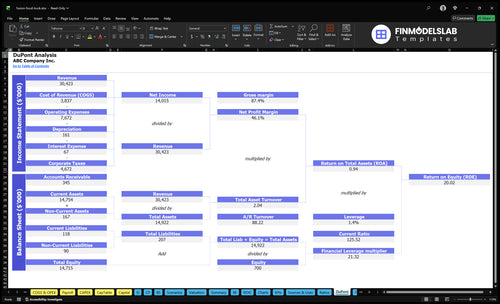
DuPont analysis
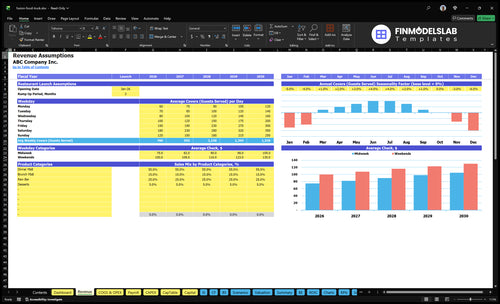
Researched revenue assumptions
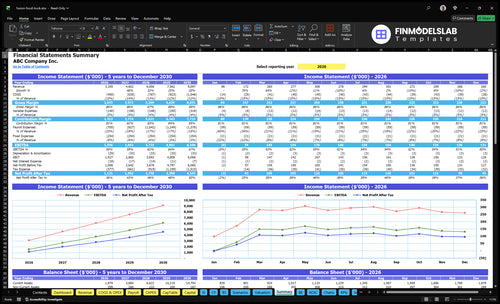
Lender-friendly financial outputs
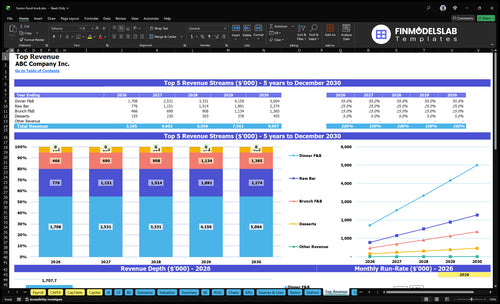
Revenue stream detailed view
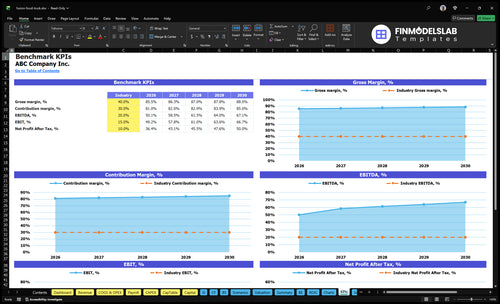
Performance metrics benchmark

The low, base, and high cases were already laid out, so I stopped wasting time building three separate versions by hand. I got my planning done in one afternoon instead of an all-day spreadsheet mess.

I could finally see where the money was going, with margins and break-even shown clearly instead of buried in formulas. That made it much easier to review the numbers before my lender meeting.
The runway view and shortfall timing were clear right away, which took a lot of guesswork out of my launch plan. I walked into my meeting with a much better sense of when cash would tighten.