

Revenue & Calc
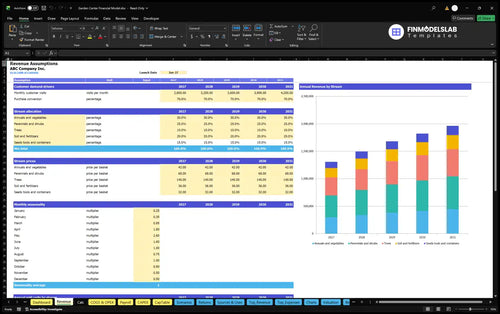
Edit monthly visits, conversion, basket receipts, category shares, seasonality, and launch timing; monthly calculations consolidate sales without counting the same completed basket in multiple categories.


The Garden Center Financial Model is an Excel template that connects customer visits, purchase conversion, seasonal demand, merchandise mix, and basket receipts to five years of financial projections. Its documented operating case runs from 2026 through 2030 and explains revenue, expenses, and EBITDA.
The case represents a leased U.S. suburban retailer with about 4,000 square feet of covered space and a half-acre plant yard, selling purchased merchandise. All case assumptions are estimates; the illustrative results do not establish industry averages or cash sufficiency.
Operating schedules translate the garden center’s demand, staffing, inventory, and funding assumptions into linked reports.
Edit monthly visits, conversion, basket receipts, category shares, seasonality, and launch timing; monthly calculations consolidate sales without counting the same completed basket in multiple categories.
Adjust merchandise costs, shrink, payment processing, fixed overhead, annual-average FTE, and compensation to understand how operating choices change margins and EBITDA.
Compare Low, Base, and High multipliers for revenue, COGS, variable expenses, fixed expenses, and payroll; review working-capital settings and financing controls on the Dashboard.
Income statement, cash flow, balance sheet, Summary, Returns, and Checks support a broader review; the supplied garden center case establishes numerical results only through EBITDA.
One converted customer-visit pool is allocated across five principal merchandise categories, with seasonal multipliers shaping monthly demand.
Monthly baseline visits rise from 2,800 in 2026 to 4,200 in 2030, while conversion remains 70%. Each completed basket belongs to one category; ancillary purchases remain within that basket, preventing duplicated orders.
The Revenue Forecast connects visits, conversion, seasonal demand, category shares, and net basket receipts to monthly and annual sales. Edit these drivers to test whether traffic growth or a different merchandise mix supports the desired revenue forecast.
| Principal basket category | Share | Net receipt |
|---|---|---|
| Annuals and vegetables | 30% | $42 |
| Perennials and shrubs | 25% | $68 |
| Trees | 10% | $140 |
| Soil and fertilizers | 20% | $36 |
| Seeds, tools, and containers | 15% | $32 |
The final category is the calculated residual share; receipts are after discounts, exclude sales tax, and remain flat in nominal dollars.
2,800 monthly baseline visits × 70% conversion × 12 seasonal multiplier total × $55.60 weighted basket receipt = $1,307,712 annual revenue.
The repeating seasonal profile ranges from 0.25 in January to 2.6 in May and sums to 12 annually. The January 31, 2026 launch counts January as a full operating month; sales are zero before the launch month.
Revenue-linked costs, fixed overhead, and separately calculated payroll determine the operating earnings shown in the example forecast.
The COGS & Operating Expense Forecast separates direct costs, variable expenses, and fixed overhead. Estimated revenue shares include landed merchandise at 49%, plant loss and shrink replacement at 2.5%, packaging at 0.3%, card processing at 2.6%, and local marketing at 1.5%.
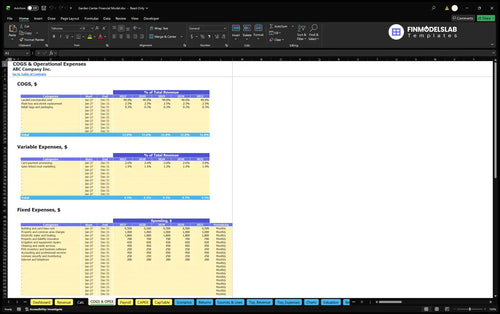
COGS totals 51.8% of revenue, with variable expenses adding 4.1%; fixed expenses remain $147,000 annually. Fixed coverage includes rent, property charges, utilities, insurance, repairs, cleaning, software, professional services, licenses, security, and communications; base rent is $6,500 monthly for 12 paid months.
The Payroll Forecast translates annual-average FTE and fixed annual base pay into personnel expenses. The case includes one manager at $60,000, one horticulture specialist at $48,000, and retail associates plus yard staff at $36,000 per FTE.
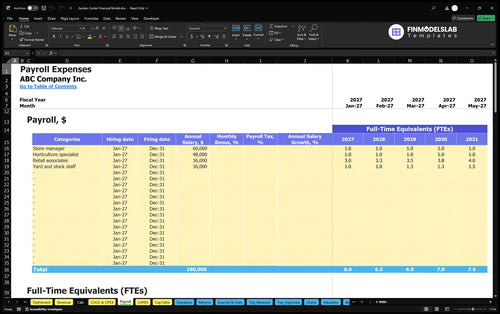
Retail associates increase from 3 to 4 FTE and yard staff from 1 to 1.5 FTE, lifting annual payroll from $252,000 to $306,000. Seasonal scheduling is represented within annual-average staffing, and these salaries are excluded from COGS, variable expenses, and fixed overhead.
Startup assets, preopening cash, opening working capital, and a reserve inform the estimated owner contribution.
The Capital Expenditure Plan schedules asset purchases and depreciation. Selected startup inputs include $65,000 for retail and yard improvements, $45,000 for shade house and irrigation, $22,000 for benches, racks, and carts, and $20,000 for material handling equipment.
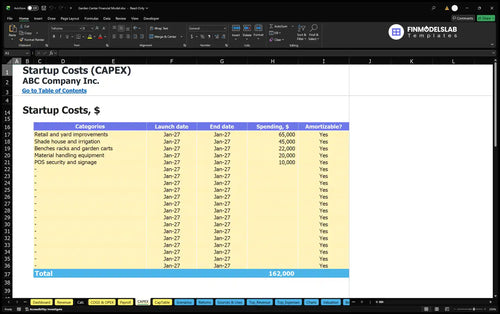
Other startup assets include POS equipment, security, and signage; separate cash items cover deposits, permits, professional fees, marketing, training, site preparation, and preopening rent and insurance. These opening uses are separate from annual operating expenses.
The Sources and Uses of Funds report reconciles cash sources and allocation over a selected period. Estimated initial owner funding is $581,217, based on assets, separate preopening cash, opening net working capital, and a reserve, less any confirmed outside funding.
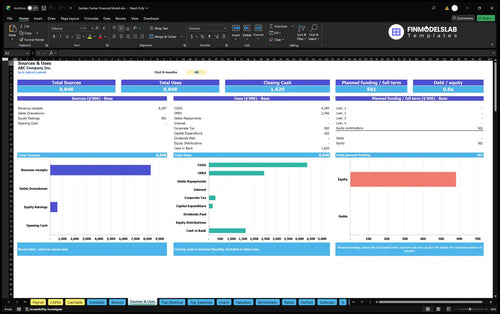
The supplied case projects higher revenue and EBITDA as visits increase while annual fixed overhead stays unchanged.
| Year | Revenue | Operating Expenses | EBITDA |
|---|---|---|---|
| 2026 | $1,307,712 | $1,130,011 | $177,701 |
| 2027 | $1,494,528 | $1,243,441 | $251,087 |
| 2028 | $1,681,344 | $1,365,871 | $315,473 |
| 2029 | $1,821,456 | $1,453,194 | $368,262 |
| 2030 | $1,961,568 | $1,549,517 | $412,051 |
Illustrative projections rounded to whole dollars; operating expenses include payroll.
Revenue increases 50% between 2026 and 2030, with unchanged conversion, basket receipts, and category shares; EBITDA margin rises from approximately 13.6% to 21.0%. Revenue-linked costs scale with sales, while payroll grows more slowly and fixed overhead remains unchanged.
The Cash Flow Forecast separates operating, investing, and financing cash movements and reconciles opening to closing cash. Use it to examine inventory purchases, asset spending, and funding timing; the supplied operating results do not establish cash balances or tested liquidity.
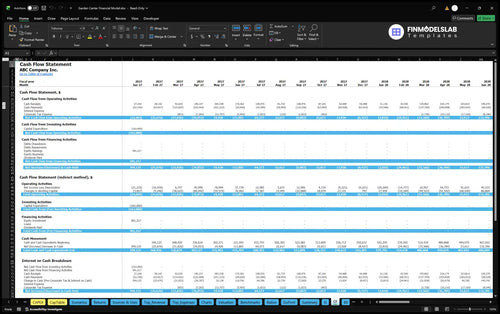
The declared Returns and financing features support distinct investment questions once the relevant cash-flow and capital assumptions are completed.
The Return on Invested Capital Analysis combines sales break-even, cash break-even timing, investment payback, and annual ROIC. Sales break-even compares revenue with operating cost coverage; cash break-even addresses cash-flow timing, payback tracks investment recovery, and ROIC measures annual returns on invested capital.
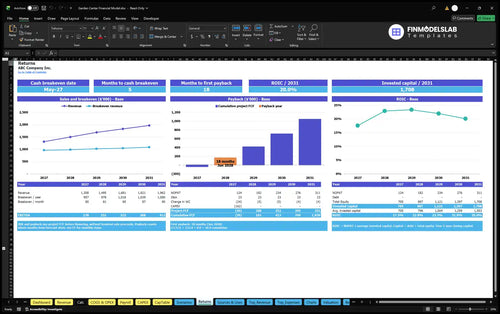
Dashboard debt controls feed financing schedules using facility amounts, dates, terms, interest rates, and repayment types. Enter proposed financing to assess repayments and interest separately from operating EBITDA; the supplied case does not establish borrowing terms, a payback date, or a ROIC result.
These answers clarify the template’s operating scope, editable assumptions, and illustrated results.
It covers an independent leased U.S. suburban garden center selling purchased merchandise, excluding commercial growing, installation, delivery, food service, and franchise operations.
Yes, the Revenue inputs cover visits, conversion, category shares, net basket receipts, seasonal multipliers, and launch timing, which feed the monthly sales calculations.
No, each completed basket is assigned to one principal category, with ancillary items included in that same full receipt and the residual share allocated to seeds, tools, and containers.
No, they are illustrative outputs from estimated planning inputs; the workbook’s separate Benchmarks report compares results with reference values entered by the user.
No, estimated initial owner funding addresses opening assets, preopening cash, net working capital, and a reserve; it is separate from annual operating expenses and EBITDA.
No, cash flow also reflects working capital, investment, and financing movements, so the supplied EBITDA forecast cannot establish cash sufficiency or investment payback.
Yes, Dashboard controls and the Scenarios report compare Low, Base, and High revenue and cost multipliers through operating profitability, including EBITDA.
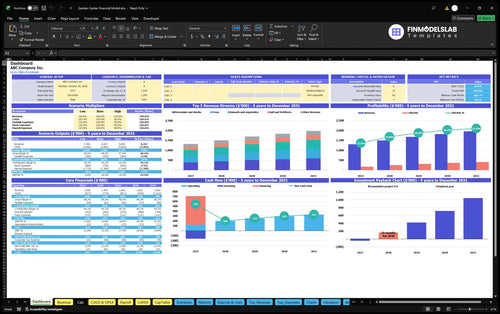
KPIs, forecasts, and cash flow at a glance.
Key assumptions and calculations driving revenue forecasts.
Funding sources, spending, and closing cash.
Cash break-even, payback, and ROIC.
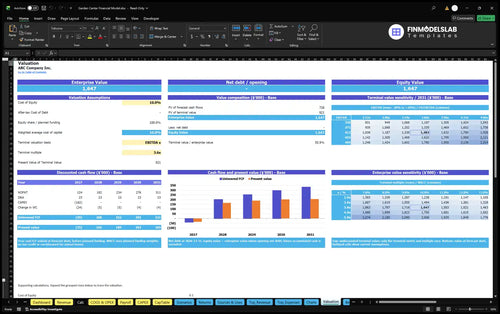
DCF valuation and sensitivity analysis.
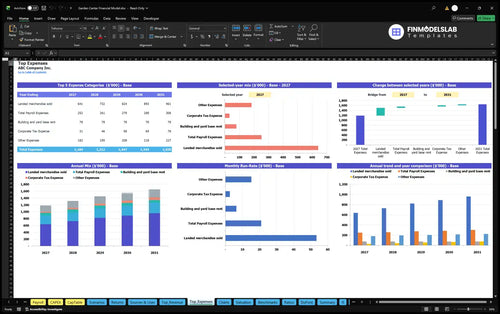
Largest costs and spending trends.
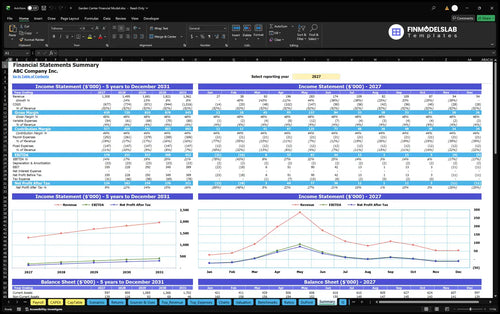
Annual and monthly financial performance.
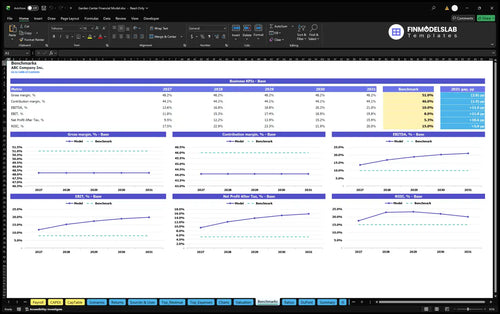
Compare margins and returns to benchmarks.

This template gave me the exact structure I was missing, so I could explain the model without second-guessing the format. I had a meeting booked with investors the same day I sent it out.
I could finally see runway and shortfalls month by month instead of guessing. That saved me hours of manual checking and made it much easier to plan funding needs.
The P&L, cash flow, and charts were all organized in one file, which cleaned up our reporting fast. I cut a full afternoon of file-hunting from each update.