

Revenue & Calc
Edit traffic, capture, gallons, fuel mix, prices, seasonality and launch timing; monthly calculations allocate one shared gallon pool across the five fuel streams.


The Gas Station Financial Model is an Excel template that turns passing traffic, fuel purchase capture, gallons per transaction and five fuel prices into monthly revenue and operating EBITDA. The illustrative forecast covers 2026–2030 in nominal U.S. dollars, with a saved launch date of January 31, 2026.
The case represents one leased, existing compliant fuel-only station on a suburban Midwest commuter corridor. It includes a payment booth, three dual-sided dispenser islands and 16 staffed hours daily; convenience retail, food and carwashing are outside this case.
The workbook connects fuel demand, purchasing costs, staffing and funding inputs with operating forecasts and financial reporting worksheets.
Edit traffic, capture, gallons, fuel mix, prices, seasonality and launch timing; monthly calculations allocate one shared gallon pool across the five fuel streams.
Adjust fuel purchasing assumptions, card costs, fixed overhead and staffing separately to assess their combined effect on operating EBITDA.
Dashboard controls apply Low, Base and High multipliers to revenue, COGS, variable expenses, fixed expenses and payroll; Scenarios compares the resulting margins and EBITDA.
IS, CF, BS and Summary support financial review, while CAPEX, CapTable, Debt, Sources & Uses and Returns support investment and funding analysis.
Monthly gallons follow eligible vehicle passes, purchase capture, gallons per fueling and one shared seasonal profile.
The 2026 case uses 400,000 eligible passes monthly, 2.5% purchase capture and 12 gallons per fueling. Capture rises to 3.1% by 2030; traffic, gallons per transaction, grade shares and pump prices remain unchanged.
Four entered grade shares and a residual E85 share allocate the same physical gallons once. Staffing and dispensers do not impose a second forecast limiter; the monthly seasonal factors total 12.00 across each full year.
The Revenue Forecast connects operating assumptions to monthly gallons and sales by fuel product. Adjusting capture changes demand directly; changing grade allocation or pump prices changes the weighted selling price, helping evaluate the revenue effect of each assumption.
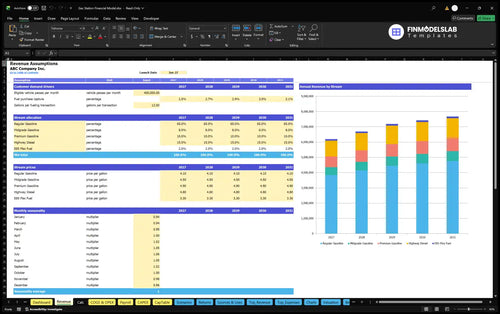
| Fuel product | Gallon share | Price per gallon |
|---|---|---|
| Regular Gasoline | 65% | $4.10 |
| Midgrade Gasoline | 8% | $4.50 |
| Premium Gasoline | 10% | $4.90 |
| Highway Diesel | 15% | $4.80 |
| E85 Flex Fuel | 2% | $3.30 |
Estimated planning inputs per physical gallon; pump prices and delivered fuel costs include motor-fuel excise.
400,000 passes/month × 2.5% capture × 12 gallons/fueling × 12.00 summed seasonal factors × $4.301 weighted price/gallon = $6,193,440.
The saved January launch produces a full active forecast year under the monthly activation convention. Selecting a later launch leaves earlier months at zero and activates full months from the selected launch month.
The operating forecast separates direct fuel purchases, variable fees, fixed site overhead and base payroll.
The COGS & Operating Expense Forecast organizes grade-specific purchasing costs, card processing, fuel shrink and fixed overhead. Revenue-linked cost assumptions vary with sales, while fixed inputs use monthly amounts and paid months to calculate annual spending.
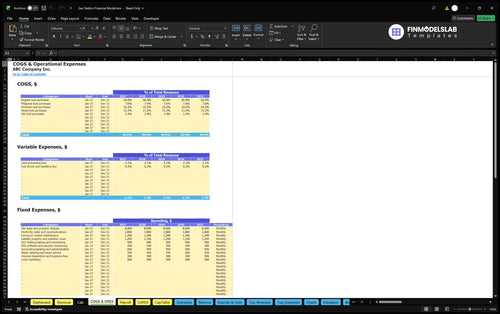
In 2026, supplied expenses comprise $5,629,104 in COGS, $140,901 in variable costs, $175,200 in fixed overhead and $166,000 in payroll. Fixed coverage includes lease charges, utilities, maintenance, insurance, UST compliance, administration and local marketing; lease and property charges are $8,000 monthly.
Base salaries are counted only in Payroll, with employer taxes, benefits and personal taxes excluded from this illustrative case. The annual table retains the supplied forecast totals.
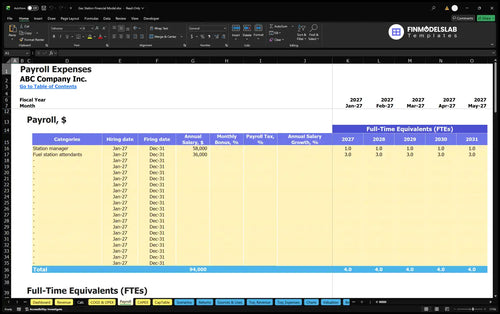
The Payroll Forecast calculates staffing costs from role-level FTE and compensation inputs. One manager at $58,000 and three attendants at $36,000 each produce $166,000 annual base payroll throughout the forecast, allowing staffing assumptions to be reviewed separately from fuel margins.
Opening funding covers assets, separate preopening cash items, net working capital and an estimated reserve.
Startup assets include a $90,000 dispenser and EMV retrofit, $25,000 in tank monitoring and safety upgrades, $15,000 in signage, $18,000 in CCTV, POS and office hardware, and booth and forecourt improvements.
Permit transfer, environmental and equipment diligence, a refundable lease deposit, preopening marketing and two weeks of base payroll are separate opening cash items. These are distinct from annual operating expenses.
The Sources and Uses of Funds report reconciles funding sources and cash allocation over selected forecast months. The illustrative owner funding is $1,804,297, including $77,111 of opening net working capital and a $1,527,801 three-month cash reserve alongside assets and preopening cash.
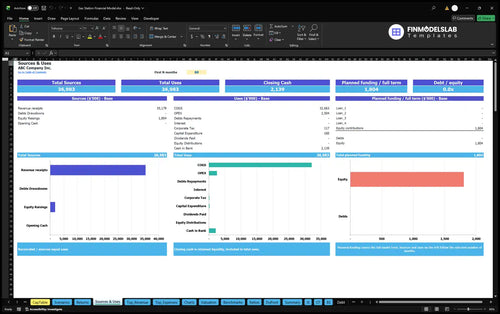
Working-capital inputs are zero receivable days, two payable days and seven inventory days. The reserve includes fuel cash purchases; cash sufficiency still requires a monthly liquidity review because no peak-cash schedule is established.
Confirmed outside funding is zero. Dashboard debt controls and the Debt schedule can model financing amounts, dates, terms, interest and repayment structures when the buyer enters financing assumptions.
The supplied operating case projects annual revenue, total operating expenses and EBITDA for all five forecast years.
| Year | Revenue | Operating Expenses | EBITDA |
|---|---|---|---|
| 2026 | $6,193,440 | $6,111,205 | $82,235 |
| 2027 | $6,688,915 | $6,572,805 | $116,110 |
| 2028 | $7,184,390 | $7,034,406 | $149,985 |
| 2029 | $7,432,128 | $7,265,206 | $166,922 |
| 2030 | $7,679,866 | $7,496,006 | $183,860 |
Illustrative projections, rounded to whole dollars; individual rounded amounts may differ slightly from displayed totals.
Higher capture increases annual gallons from 1,440,000 to 1,785,600 while prices and mix stay constant. Revenue grows 24% between 2026 and 2030; EBITDA rises as fixed overhead and base payroll remain unchanged.
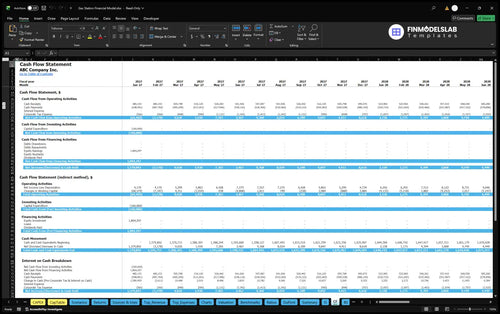
The Cash Flow Forecast tracks operating, investing and financing movements and reconciles opening to closing cash. Use it to evaluate fuel inventory payments, startup spending and financing timing; the supplied numerical case establishes operating results through EBITDA only.
The Returns report addresses operating cost coverage, cash timing, investment recovery and annual capital efficiency as distinct measures.
The Return on Invested Capital Analysis brings together sales break-even, cash break-even timing, investment payback and annual ROIC. Use these functions to assess how traffic capture, fuel margins and opening investment affect cost coverage, recovery timing and returns on invested funds.

Sales break-even measures required revenue; cash break-even concerns cash timing; investment payback measures recovery of invested funds; annual ROIC measures return on invested capital. The supplied case does not establish a payback date or ROIC result, and EBITDA does not establish net profit or available cash.
This template fits demand-based planning for an existing fuel station with five documented fuel products.
The Midwest site is illustrative, with no exact city or signed lease, and selections are estimates rather than validated local benchmarks. Replace traffic capture, fuel economics, lease charges and opening investment with site-specific evidence before using the projections for a business decision.
Key questions about inputs, operating scope and interpretation of the example.
Yes, edit four fuel shares and each pump price; E85 takes the remaining share, and all five products draw from one physical gallon pool.
No, the documented case covers fuel sales only, with a small payment booth and no convenience retail, food or carwash revenue.
No, demand determines gallons sold; staffing and equipment do not apply a separate capacity ceiling in this case.
Yes, Dashboard controls apply separate multipliers to revenue, COGS, variable expenses, fixed expenses and payroll, with scenario comparisons of operating profitability.
No, it is an estimated opening funding plan including a three-month reserve; the supplied evidence does not include a peak-cash schedule.
No, EBITDA precedes depreciation, interest and corporate tax, and it excludes investment and financing cash movements; net profit and available cash require separate review.
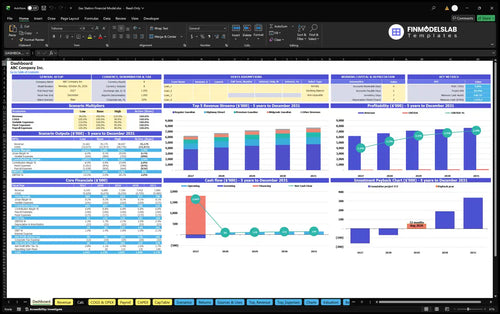
KPIs, forecasts, and cash flow at a glance.
Key assumptions and calculations driving revenue forecasts.
Funding sources, spending, and closing cash.
Cash break-even, payback, and ROIC.

DCF valuation and sensitivity analysis.

Largest costs and spending trends.
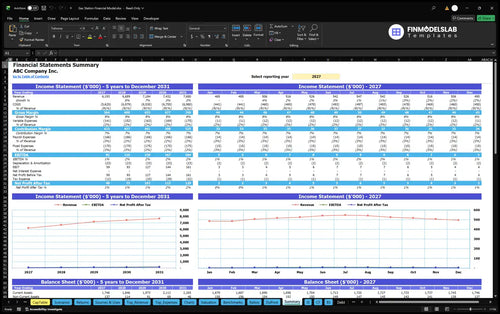
Annual and monthly financial performance.
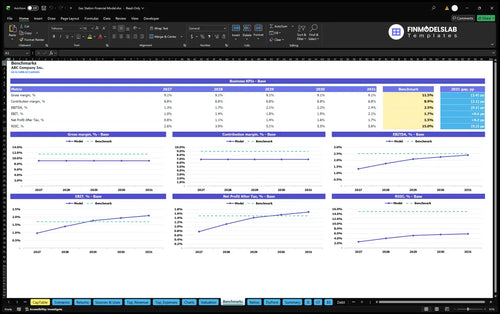
Compare margins and returns to benchmarks.

It pulled pricing, costs, and growth into one place, so I stopped juggling messy tabs and finally had a clean set of numbers to review with my partner. We saved about 4 hours on the first pass.
I was stuck before I even opened Excel, but this template gave me a starting point for the whole gas station model. What would have taken a full day of setup was done in under an hour.

The statements and charts were scattered all over my old files, and this brought them into one view. I had a cleaner monthly report ready for my lender meeting, and it saved me a couple of hours of rework.