

Revenue & Calc
Edit annual-average paid members, exclusive package shares, monthly prices and launch timing to build monthly revenue by package and annual sales totals.


The Gym Financial Model is an Excel template that connects paid memberships, inclusive package prices, operating expenses and staffing to financial projections. Its illustrative 2026–2030 operating case shows how a growing member base changes revenue and EBITDA.
The planning case covers an independent, leased 8,000-square-foot suburban U.S. club in existing fitness premises. It excludes a pool, sauna, childcare, retail and franchise operations; the assumptions are estimates without a site-specific lease.
The workbook links gym operating assumptions with monthly calculations, financial statements and decision reports.
Edit annual-average paid members, exclusive package shares, monthly prices and launch timing to build monthly revenue by package and annual sales totals.
Plan revenue-linked costs, monthly fixed spending and role-based FTE separately to understand how membership growth absorbs rent, staffing and other overhead.
Schedule investment and owner contributions, then use Dashboard debt controls and Debt schedules for financing assumptions entered by the user; this case assumes no committed non-owner funding.
IS, CF, BS and Summary connect profitability, cash flow and financial position; Dashboard, Scenarios and Returns support comparison and investment review without establishing additional numerical results for this illustration.
Revenue equals paid member months multiplied by each exclusive package share and its inclusive monthly price.
Annual-average paid membership rises from 450 in 2026 to 600, 720, 820 and 900 in subsequent years. Each member month belongs to one package, so coaching and personal training are not duplicated as additional revenue.
The January 31, 2026 launch activates the full calendar month without daily proration, giving 12 active months in 2026. Annual averages step up by forecast year, with no selected monthly seasonality or independent capacity ceiling.
| Package | Member-month share | Monthly price |
|---|---|---|
| Open Gym | 35% | $39 |
| Gym and Classes | 35% | $59 |
| All Access | 20% | $79 |
| Small Group Coaching | 7% | $129 |
| Personal Training | 3% | $249 |
Shares total 100%; the weighted average monthly price is $66.60.
The Revenue Forecast connects membership demand, package mix, prices and launch timing to monthly sales. Adjust these inputs to compare the revenue effect of recruiting more members, changing the mix or revising prices.
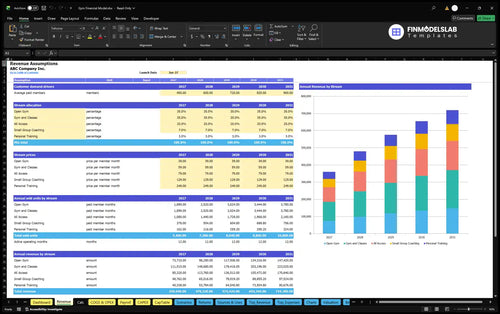
450 average paid members × $66.60 per member month × 12 active months = $359,640 annual revenue.
Direct and variable costs scale with revenue, while monthly overhead and fixed base salaries remain separate.
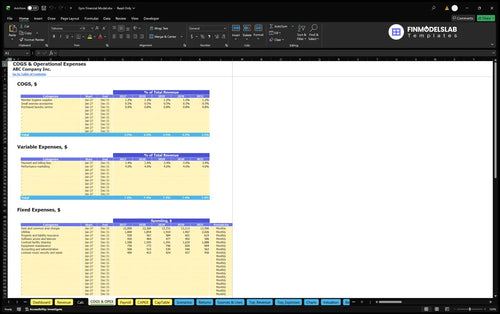
Estimated COGS includes hygiene supplies at 1.2%, exercise accessories at 0.5% and purchased laundry at 0.8% of revenue. Payment and billing fees at 3.4% and performance marketing at 4% are variable operating expenses.
Fixed costs cover rent, utilities, insurance, software, cleaning, maintenance, administration and other facility charges. Rent and common area charges begin at $12,000 per month; total fixed operating expenses increase from $215,400 in 2026 to $242,435 in 2030.
The COGS & Operating Expense Forecast organizes direct, variable and fixed costs into monthly spending. Reviewing these categories against membership revenue helps assess how much additional sales contribute toward payroll, facility overhead and EBITDA.
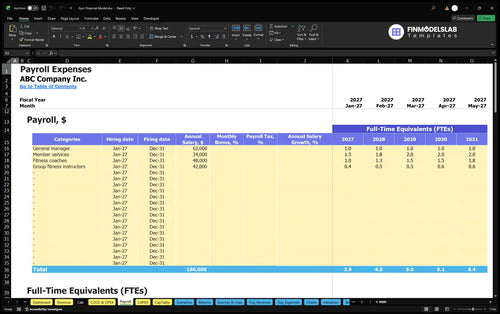
| Role | 2026 FTE | 2030 FTE | Annual base / FTE |
|---|---|---|---|
| General manager | 1 | 1 | $62,000 |
| Member services | 1.5 | 2 | $34,000 |
| Fitness coaches | 1 | 1.75 | $48,000 |
| Group fitness instructors | 0.4 | 0.6 | $42,000 |
FTE measures full-time-equivalent staffing, not a count of individual employees.
The Payroll Forecast converts role-level FTE and salaries into personnel expenses. Annual base payroll rises from $177,800 in 2026 to $239,200 in 2030, with salaries recorded once through Payroll and excluded from COGS and other operating expense categories.
Estimated initial owner funding of $499,302 covers the startup budget, opening working capital and a three-month first-year cash-outflow reserve.
The Capital Expenditure Plan schedules asset purchases and depreciation. Specified startup budgets include $90,000 for strength equipment, $80,000 for cardio equipment, $100,000 for leasehold improvements and $15,000 for group training equipment, with access hardware and reception furnishings also included as asset categories.
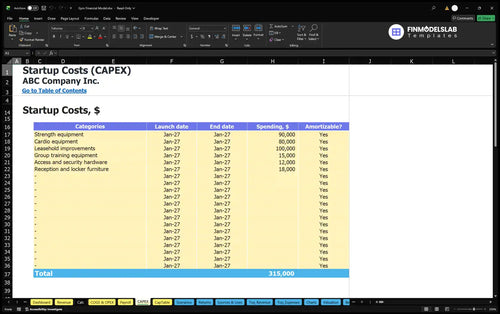
Separate opening cash items include refundable lease and utility deposits, permits, legal formation, launch marketing, preopening training and base pay, preopening rent and utilities, and website setup. These startup allocations are distinct from annual operating expenses and operating earnings.
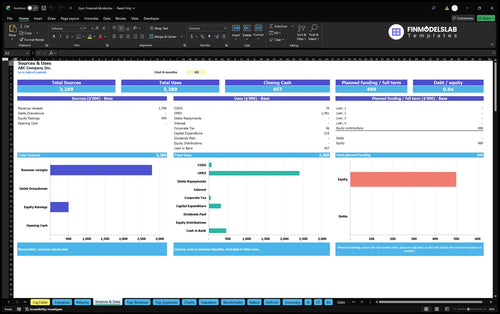
The Sources and Uses of Funds report reconciles cash sources with operating, investment and financing uses over selected forecast months. Use it to review how planned owner contributions and any separately entered financing support cash allocation.
The estimated 2026–2030 case shows revenue rising as membership expands, with a first-year operating loss followed by positive EBITDA.
| Year | Revenue | Operating Expenses | EBITDA |
|---|---|---|---|
| 2026 | $359,640 | $428,804 | −$69,164 |
| 2027 | $479,520 | $469,734 | $9,786 |
| 2028 | $575,424 | $508,485 | $66,939 |
| 2029 | $655,344 | $525,352 | $129,992 |
| 2030 | $719,280 | $552,843 | $166,437 |
Illustrative projections, not observed results or industry averages; amounts are rounded to whole dollars.
Operating expenses include COGS, variable expenses, fixed overhead and payroll. The member ramp improves EBITDA while staffing and facility costs remain in place; the 2027 positive result does not establish a specific monthly break-even date.
EBITDA is not net profit or available cash. Depreciation, interest, taxes, capital purchases, working-capital movements and financing require their respective statement calculations before assessing investor returns or liquidity.
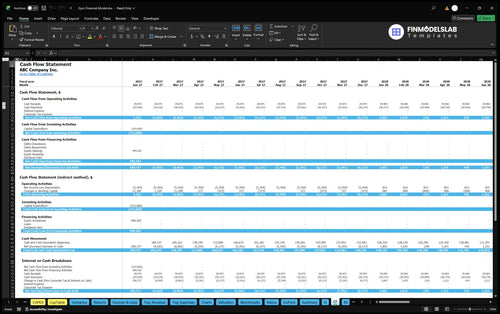
The Cash Flow Forecast presents operating, investing and financing movements with an opening-to-closing cash reconciliation. Use it to examine purchase timing, owner contributions and cash collection separately from the EBITDA forecast shown here.
Returns and scenario tools help evaluate distinct operating and investment questions using the assumptions entered in the workbook.
Dashboard Low, Base and High multipliers adjust revenue, COGS, variable expenses, fixed expenses and payroll. Compare their effect on revenue, margins and EBITDA to examine how softer membership revenue or higher staffing costs change operating performance.
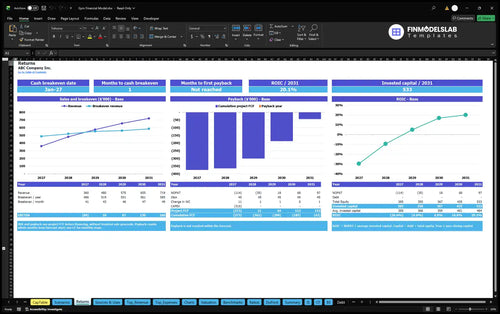
The Return on Invested Capital Analysis combines sales break-even, cash break-even, investment payback and annual ROIC. Sales break-even assesses operating cost coverage, cash break-even identifies when cash inflows cover cash outflows, payback tracks investment recovery, and ROIC measures returns relative to invested capital.
This model fits a leased gym using recurring, inclusive membership packages and a fixed-base-pay staffing plan.
Use the supplied estimates as a starting point for your own member targets, package pricing, lease terms, staffing and equipment budgets. Clubs with pools, childcare, retail, franchise charges or separately sold coaching need assumptions reflecting those additional activities.
These answers clarify the editable assumptions, forecast scope and interpretation of the illustrated case.
You can edit annual-average paid members, exclusive package shares, inclusive monthly prices and launch timing to build the revenue forecast.
No; Personal Training is an exclusive, inclusive package within the same member pool, so its revenue is not counted again as a coaching add-on.
The launch control activates the full calendar month without daily proration, so this January 31, 2026 case includes 12 active months in its first year.
The documented staffing case includes fixed base salaries only and excludes employer taxes, benefits and workers compensation, even though the standard Payroll sheet supports broader personnel inputs.
No; investment payback depends on the relevant cash flows and initial investment, while EBITDA measures operating earnings before interest, taxes, depreciation and amortization.
No; they are illustrative projections based on estimated planning inputs, and the documented case does not establish net profit, cash sufficiency or an investment payback period.
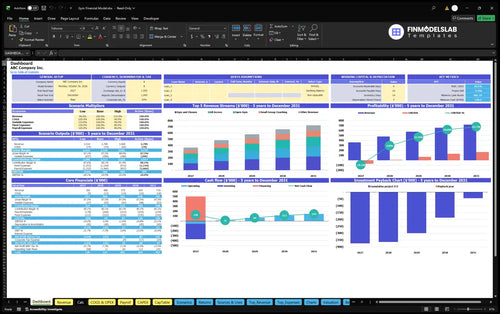
KPIs, forecasts, and cash flow at a glance.
Key assumptions and calculations driving revenue forecasts.
Funding sources, spending, and closing cash.
Cash break-even, payback, and ROIC.
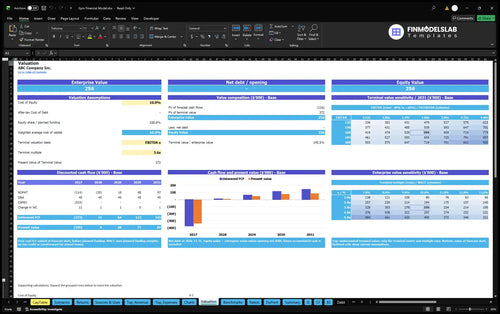
DCF valuation and sensitivity analysis.
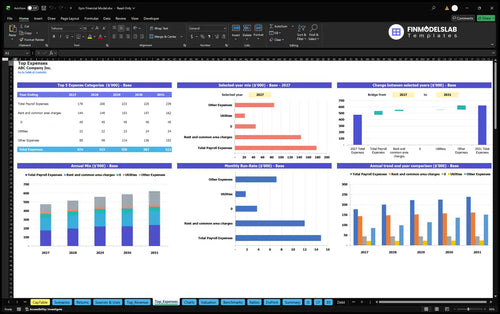
Largest costs and spending trends.

Annual and monthly financial performance.
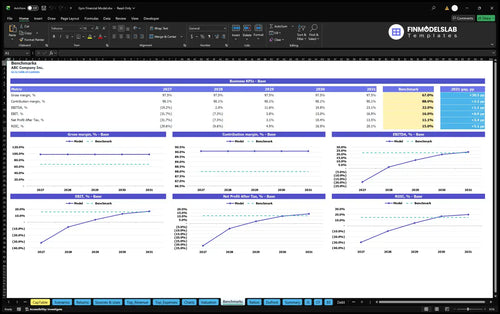
Compare margins and returns to benchmarks.

This template made margins and break-even easy to see in one place, so I could spot the weak spots fast. It saved me hours of manual checks and gave me a cleaner plan to discuss with my team.

I finally understood what investors wanted to see and how to structure the numbers. That clarity helped me finish the model faster and book a meeting without second-guessing the format.
I’m not strong in advanced Excel, and this kept the model simple to use. The layout helped me build a full forecast without hiring extra help, and I finished it in one afternoon.