

Revenue & Calc
Edit staffed daily places, utilization, care-level mix, net rates and launch timing; Revenue and Calc translate these inputs into monthly patient days and revenue across 60 forecast months.


The Hospice Care Financial Model is an Excel template for planning an independent US home hospice. It connects staffed census capacity, utilization, care mix and estimated net daily rates with staffing and operating costs to build financial projections for 2026–2030.
The illustrated case assumes existing Medicare enrollment and certification, a leased 2,000-square-foot administrative office and contracted inpatient and respite beds. All selected assumptions and results describe an estimated planning case; the documented operating forecast ends at EBITDA.
The workbook connects hospice operating assumptions with monthly calculations, financial statements and management reports.
Edit staffed daily places, utilization, care-level mix, net rates and launch timing; Revenue and Calc translate these inputs into monthly patient days and revenue across 60 forecast months.
Plan medicines, equipment, contracted care, field travel and salaried roles separately, then assess how changes in clinical coverage, expense rates and fixed overhead affect operating earnings.
Set Low, Base and High multipliers for revenue, COGS, variable expenses, fixed expenses and payroll on Dashboard; Scenarios compares operating margins and EBITDA under those selections.
IS, CF and BS provide financial statement views, while Summary combines them for review; Checks tests reconciliations and input consistency without guaranteeing that assumptions will be achieved.
Staffed places, utilization and the exclusive care mix determine the hospice revenue forecast.
Monthly patient days equal staffed daily places × 365/12 planning days × utilization. Allocate that pool once across five categories, then multiply each allocation by its selected net daily rate; this avoids counting the same capacity more than once.
Staffed places increase from 30 in 2026 to 90 in 2030, while utilization rises from 50% to 80%, producing average daily census of 15 and 72. Utilization is an input, with no separate demand limit or patient-cohort progression schedule.
The Revenue Forecast shows operating drivers, patient-day volumes and revenue by care category. Changing capacity, utilization, mix or price helps evaluate how much revenue the staffing plan must support.
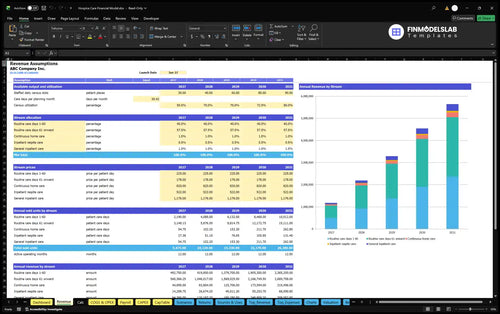
| Care category | Share of days | Net rate per day |
|---|---|---|
| Routine care, days 1–60 | 40% | $225 |
| Routine care, day 61 onward | 57.5% | $178 |
| Continuous home care | 1% | $820 |
| Inpatient respite care | 0.5% | $522 |
| General inpatient care | 1% | $1,176 |
The mix totals 100% and yields an estimated blended rate of $214.92 per patient day; these selections are planning assumptions, not verified reimbursement quotes.
30 staffed places × 365 planning days × 50% utilization × $214.92 blended daily rate = $1,176,687.
The January 31, 2026 launch input receives full January activity under the model’s timing convention, with zero revenue in earlier months. Calculations use 365/12 days per month; the displayed 30.42 is rounded.
The operating forecast deducts direct care costs, variable expenses, fixed overhead and payroll from revenue.
The COGS & Operating Expense Forecast separates direct care costs, variable spending and fixed overhead. Estimated direct costs total 23% of revenue, including medicines, consumables, equipment, purchased beds, crisis nursing, therapies, transport and diagnostics.
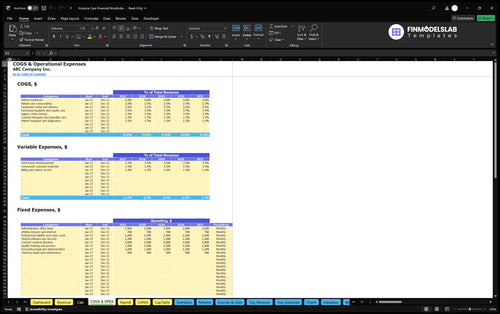
Variable expenses total 6.2% of revenue: field travel at 3.5%, outreach materials at 1.5% and billing services at 1.2%. Fixed expenses remain $189,600 annually, including a $3,500 monthly office lease plus insurance, software, medical direction and administrative support.
The Payroll Forecast calculates personnel costs from role-level FTE, compensation and employment dates. The case increases RN case managers from 2 to 7.2 annual-average FTE and field aides from 2 to 7.5 FTE between 2026 and 2030.
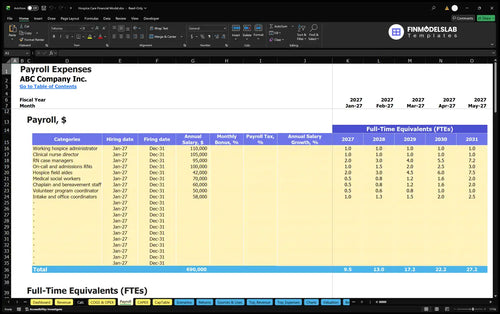
Annual payroll rises from $737,000 to $1,969,000 and includes the paid working administrator. Employer taxes and benefits are excluded from this case; direct labor already included in COGS is not counted again in payroll.
The estimated $609,058 owner contribution covers opening investment and reserves separately from annual operating expenses.
The Capital Expenditure Plan schedules asset purchases and depreciation. Listed startup assets total $70,000: secure technology at $28,000, furniture at $12,000, qualifying office improvements at $18,000 and durable clinical assessment kits at $12,000.
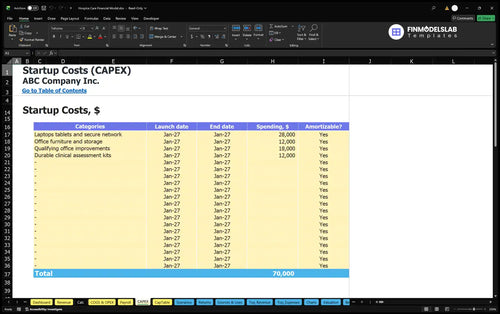
Separate opening cash items include the refundable deposit, software implementation, contracting, prelaunch onboarding, occupancy and outreach. Working-capital inputs are 45 receivable days, 10 payable days and 2 inventory days, allowing collection and payment timing to be evaluated separately from EBITDA.
The Sources and Uses of Funds report reconciles funding and cash allocation over a selected period. The owner-funding estimate includes assets, separate prelaunch cash, opening working capital and a three-month recurring-cost reserve; it is not a tested peak-funding requirement.
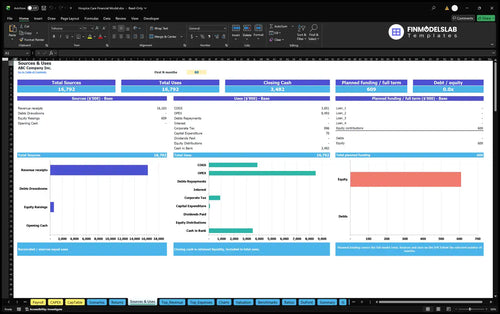
The supplied scenario moves from a 2026 EBITDA loss to positive annual EBITDA beginning in 2027.
| Year | Revenue | Operating Expenses | EBITDA |
|---|---|---|---|
| 2026 | $1,176,687 | $1,270,193 | -$93,506 |
| 2027 | $2,196,482 | $1,813,473 | $383,010 |
| 2028 | $3,294,724 | $2,416,159 | $878,564 |
| 2029 | $4,549,856 | $3,131,658 | $1,418,198 |
| 2030 | $5,648,098 | $3,807,845 | $1,840,253 |
Illustrative projections, not historical results or industry averages; amounts are rounded independently to whole dollars, so displayed subtraction can differ by one dollar.
Capacity and utilization drive revenue growth while selected daily rates and care mix remain constant. Payroll increases with planned staffing, while fixed overhead stays unchanged; the resulting EBITDA excludes depreciation, interest and taxes and does not establish net profit or investment recovery.
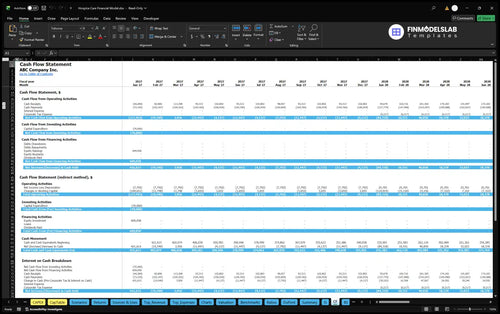
The Cash Flow Forecast separates operating, investing and financing cash movements and reconciles opening to closing cash. Use it to assess collection delays, asset purchases and funding timing; the supplied EBITDA figures do not establish cash sufficiency.
The Returns report distinguishes operating cost coverage, cash timing, investment recovery and annual capital returns.
The Return on Invested Capital Analysis combines sales break-even, cash break-even timing, investment payback and annual ROIC. Review these measures against the hospice’s staffing commitments and opening investment after updating the operating and financing assumptions.
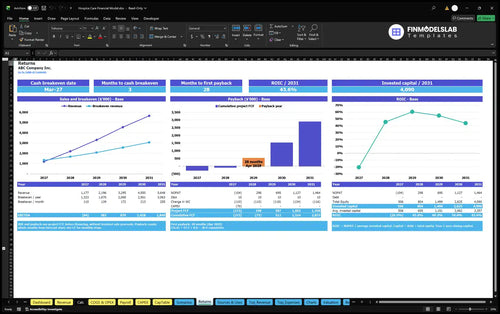
Sales break-even assesses revenue needed to cover operating costs; cash break-even assesses cash timing. Investment payback evaluates recovery of invested funds, while annual ROIC measures returns on invested capital; no case-specific payback date or ROIC result is supplied.
Dashboard debt controls support four financing facilities, with amounts, dates, terms, rates and repayment types feeding Debt schedules. These tools can test borrowing assumptions, but the supplied funding amount represents owner capital and establishes no loan terms or borrowing eligibility.
This case fits an already enrolled freestanding hospice planning census growth and contracted acute-care coverage.
The scenario uses a generic mid-cost US market, wage-index 1 planning context and a pass-through LLC. It assumes no acquisition purchase, new certification forecast, owned inpatient facility or skilled-nursing room-and-board business, and excludes personal taxes.
Use these answers to check the template’s assumptions and scope before adapting the case.
Yes, edit staffed places, utilization, the five exclusive care-day shares and net daily rates to recalculate patient-day volumes and revenue.
No, routine-care tiers use selected shares of one patient-day pool; the documented revenue engine has no patient-cohort progression schedule.
No, the selected net rates are estimated planning assumptions and should be reviewed for the operation being modeled.
Yes, the case includes a paid working hospice administrator at $110,000 annually; employer taxes and benefits are excluded from the supplied payroll scope.
No, evaluate cash flow, investment payback and annual ROIC separately; the supplied annual EBITDA results do not establish those outcomes.
No, existing Medicare enrollment and certification are prerequisites; the illustrated case does not forecast new certification or an owned inpatient facility.
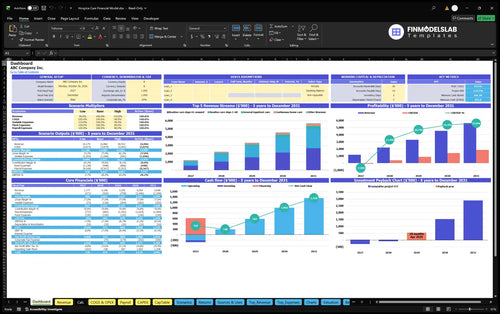
KPIs, forecasts, and cash flow at a glance.
Key assumptions and calculations driving revenue forecasts.
Funding sources, spending, and closing cash.
Cash break-even, payback, and ROIC.
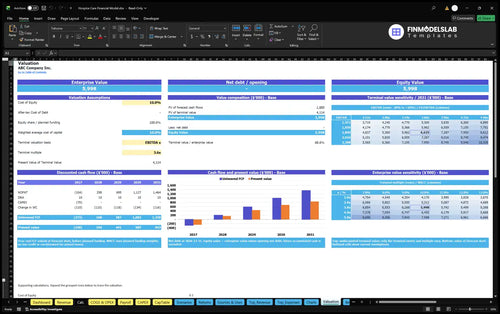
DCF valuation and sensitivity analysis.

Largest costs and spending trends.
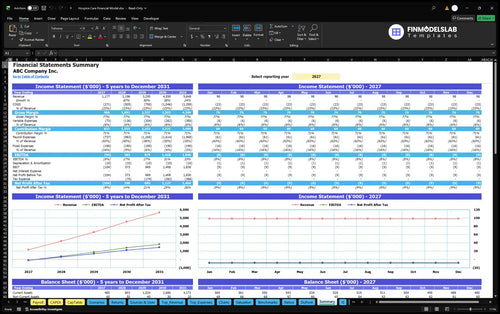
Annual and monthly financial performance.
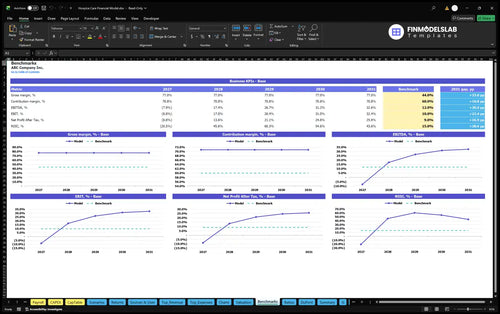
Compare margins and returns to benchmarks.

I’m not a finance person, so the built-in structure made the Hospice Care model much easier to follow. I got my assumptions entered in under an hour and could finally explain the numbers without getting lost in formulas.

Building projections from scratch was taking me forever. This template cut my prep time by two days and gave me a clean first draft I could send to the team the same afternoon.
I used to have statements in one file and charts in another, which was a mess. With this model, everything sat together and I had a board-ready packet ready in one place.