

Revenue & Calc
Edit room inventory, occupancy, seasonality, category mix, nightly prices, and launch timing to build the monthly revenue forecast.


The Hotel Financial Model is a five-year Excel template for planning room revenue, operating costs, and staffing for a 40-room independent select-service hotel. It converts available room nights, occupancy, seasonality, room mix, and realized nightly prices into financial projections.
The illustrated case uses a leased, existing suburban US property with complimentary continental breakfast. Forecasts cover 2026–2030, with a January 31, 2026 launch date and sales starting in the launch month; all selected inputs are estimates, and no specific property is selected.
The workbook connects hotel operating inputs with monthly calculations, financial statements, and management reports.
Edit room inventory, occupancy, seasonality, category mix, nightly prices, and launch timing to build the monthly revenue forecast.
Plan revenue-linked costs, lease expenses, role-based staffing, and property improvements separately so operating costs and investment spending remain distinguishable.
Select Low, Base, or High multipliers for revenue, COGS, variable expenses, fixed expenses, and payroll; compare their effects on margins and EBITDA.
Use IS, CF, BS, and Summary to review linked financial statements; CapTable, Debt, and Sources & Uses organize equity, financing schedules, and cash allocation.
Available rooms multiplied by calendar days, occupancy, and the seasonal factor determine the shared monthly pool of sold room nights.
Room inventory stays at 40; annual occupancy assumptions are 52%, 58%, 62%, 64%, and 65% for 2026 through 2030, respectively. Repeating seasonal factors include 0.8 in January and 1.2 in July.
The model allocates sold nights across five categories, then applies each category’s realized nightly price. Accessibility spans these categories rather than forming a separate commercial price class.
The Revenue Forecast connects room capacity, projected sold nights, category mix, and nightly prices to sales. Adjust these inputs to compare occupancy and pricing plans without counting the same room-night pool more than once.
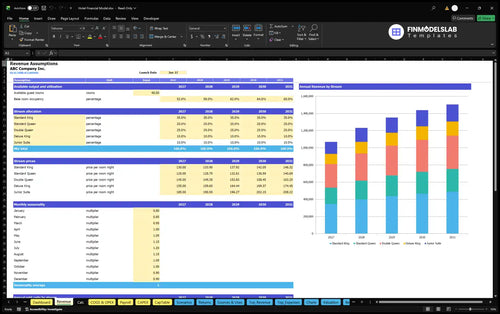
| Room category | Sold-night mix | Nightly price |
|---|---|---|
| Standard King | 35% | $130 |
| Standard Queen | 20% | $125 |
| Double Queen | 25% | $145 |
| Deluxe King | 10% | $155 |
| Junior Suite | 10% | $185 |
Prices are per sold room night; category shares total 100%.
40 rooms × 31 days × 52% occupancy × 1.2 seasonal factor = 773.76 projected sold room nights.
The 2026 mix produces a weighted nightly price of $140.75, giving approximately $108,907 in July room revenue. Fractional room nights represent planning averages; staffing supports operations without independently generating sales.
Revenue-linked expenses change with sales, while lease commitments and staffing plans determine much of the operating cost base.
COGS total 11% of revenue: supplies and cleaning materials at 3.5%, breakfast materials at 3.5%, and outsourced laundry at 4%. Variable expenses total 11.4%: commissions at 6%, processing at 3.2%, marketing at 2%, and credit losses at 0.2%.
The COGS & Operating Expense Forecast separates direct, variable, and fixed expenses. Monthly property lease and charges rise from $20,000 in 2026 to approximately $22,510 in 2030; fixed costs also include utilities, insurance, repairs, software, professional services, and other operating overhead.

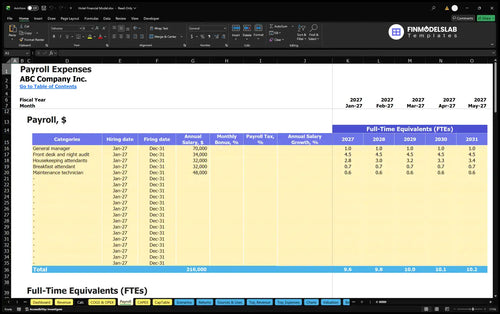
Front desk and night audit remain at 4.5 annual-average FTE, while housekeeping increases from 2.8 to 3.4 FTE. The plan also includes a manager, breakfast attendant, and maintenance technician; these staffing measures are not employee headcounts.
The Payroll Forecast calculates personnel costs from roles, compensation, hiring dates, and FTE assumptions. Illustrated annual payroll rises from $363,800 in 2026 to $383,000 in 2030; outsourced laundry remains a separate cost, and employer taxes, benefits, and personal taxes are excluded from this case.
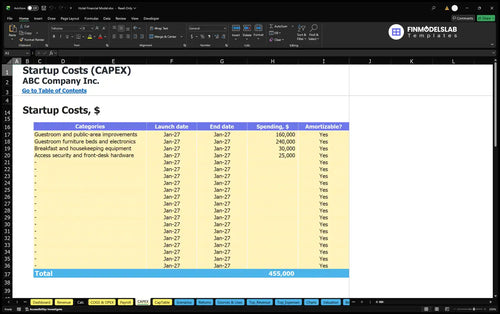
This leased-property case budgets improvements and equipment rather than purchasing or developing a hotel.
Startup asset inputs total $455,000: improvements of $160,000, furniture, beds, and electronics of $240,000, breakfast and housekeeping equipment of $30,000, and access, security, and front-desk hardware of $25,000.
The Capital Expenditure Plan schedules asset spending and depreciation from budgets, dates, and depreciability settings. Use it to distinguish refurbishment purchases from recurring lease payments and operating expenses.
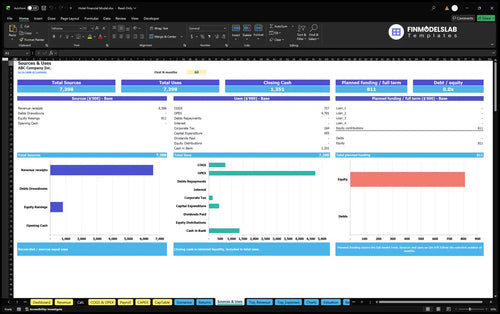
Deposits, setup, launch marketing, and preopening costs are separate startup cash items. Initial owner funding is approximately $811,335 from the source startup budget; this input does not establish a tested financing requirement.
Sources and Uses of Funds reconciles cash receipts, funding, payments, and retained cash over selected forecast months. Dashboard debt controls support four facilities with repayment schedules, allowing financing assumptions to be entered without treating borrowings as room revenue.
The selected hotel scenario produces positive EBITDA throughout 2026–2030; the supplied numerical results stop at this operating earnings measure.
| Year | Revenue | Operating Expenses | EBITDA |
|---|---|---|---|
| 2026 | $1,069,599 | $999,390 | $70,209 |
| 2027 | $1,228,804 | $1,053,332 | $175,472 |
| 2028 | $1,356,111 | $1,100,485 | $255,626 |
| 2029 | $1,438,485 | $1,134,741 | $303,745 |
| 2030 | $1,504,819 | $1,165,781 | $339,038 |
Illustrative projections, rounded independently to whole dollars; displayed totals may differ by $1.
Higher occupancy and nightly prices increase projected revenue while lease and staffing costs continue to absorb cash. Positive EBITDA does not establish net profit, positive cash flow, or investment recovery.
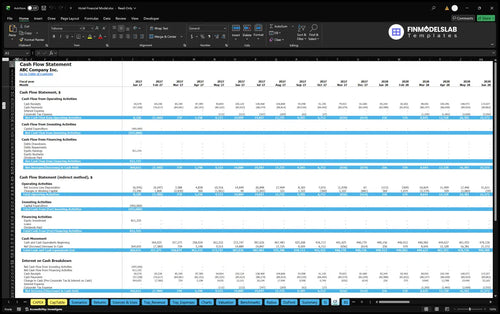
The Cash Flow Forecast tracks operating, investing, and financing cash movements and reconciles opening to closing cash. Receivable days of 3, payable days of 10, and inventory days of 13 affect working-capital timing; they are separate from annual expense inputs.
Returns reports help assess operating thresholds and capital recovery using the workbook’s linked calculations.
The Return on Invested Capital Analysis combines sales break-even, cash break-even timing, investment payback, and annual ROIC. These functions support investment review, but the supplied case does not establish numerical return results.
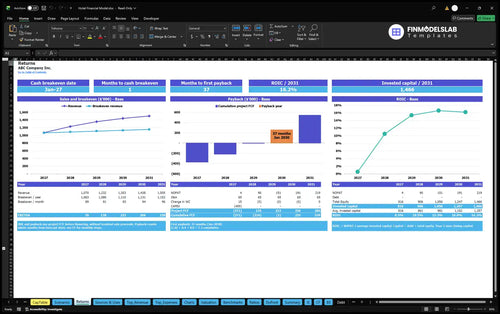
Sales break-even tests the revenue needed to cover modeled operating costs; cash break-even addresses cash timing. Investment payback tracks recovery of invested funds through project cash flow, while annual ROIC measures annual operating returns relative to invested capital.
The template suits owners and advisers evaluating a leased hotel with room-led sales and limited amenities.
The case excludes a restaurant, bar, pool, and meeting business. Replace the estimated rates, occupancy, lease, staffing, and startup inputs with property-specific assumptions before using the financial projections for a decision.
These answers clarify the template’s scope and how to interpret the illustrated case.
Yes; the Revenue inputs include room capacity, occupancy, seasonal factors, category mix, and annual nightly prices that feed monthly revenue calculations.
Yes; the case includes breakfast materials and a breakfast attendant, with no separate breakfast revenue stream.
No; it assumes a leased existing property, with refurbishment, equipment, deposits, and other startup cash items.
No; they are illustrative projections based on estimated inputs, with no selected city or property.
No; payback depends on project cash flows and invested funds, and no payback result is supplied for this case.
Yes; Dashboard scenario controls apply Low, Base, and High multipliers to revenue and major expense groups, with comparisons of margins and EBITDA.
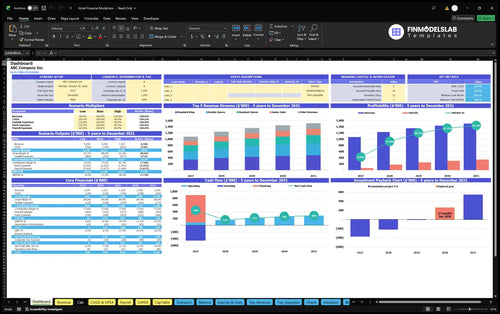
KPIs, forecasts, and cash flow at a glance.
Key assumptions and calculations driving revenue forecasts.
Funding sources, spending, and closing cash.
Cash break-even, payback, and ROIC.
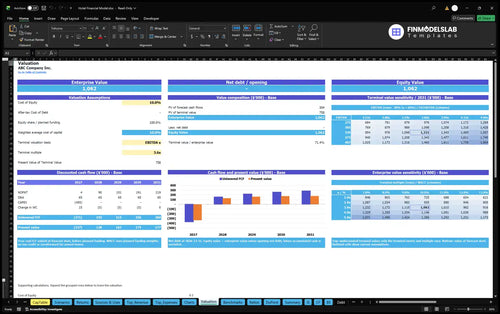
DCF valuation and sensitivity analysis.
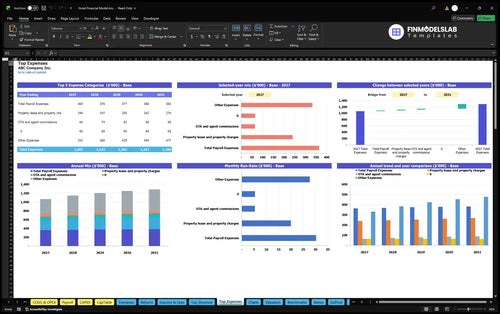
Largest costs and spending trends.
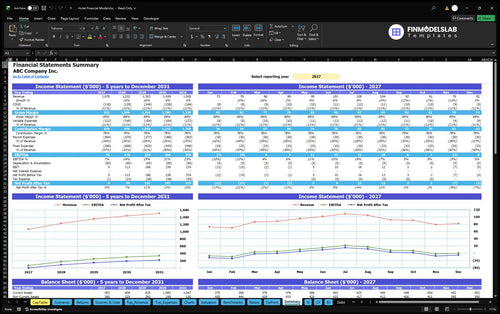
Annual and monthly financial performance.
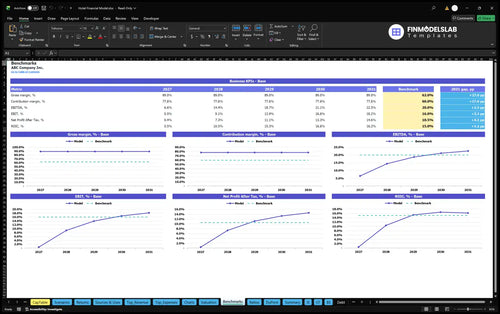
Compare margins and returns to benchmarks.

The cash flow forecast made it easy to see our runway and likely shortfalls months ahead, which saved us from guessing. We cut a half-day planning meeting down to 30 minutes because the assumptions were finally in one place.
I wasn’t sure what investors wanted to see, but this template gave me the right layout and outputs right away. It saved me about 8 hours of rework before our first fundraising call.
Our statements and charts were spread across too many files, and this cleaned it up fast. I pulled the monthly report together in under an hour instead of chasing tabs all afternoon.