

Revenue and Calc
Edit launch timing, service days, practical treat capacity, utilization, seasonality, product allocation, and realized prices; monthly calculations convert the shared truck capacity into volumes and revenue by category.


The Ice Cream Truck Financial Model is an Excel template for planning one owner-operated truck selling packaged frozen treats and soft serve on suburban routes and at booked events. It connects seasonal service capacity, product mix, net prices, operating costs, and staffing to a five-year forecast.
The illustrative Raleigh-Durham, North Carolina case covers 2026–2030 in nominal US dollars. All years are planning forecasts, sales tax is excluded from net sales, and the supplied numerical results end at EBITDA.
The workbook links operating assumptions to monthly calculations, financial statements, and management reports for reviewing a mobile ice cream business.
Edit launch timing, service days, practical treat capacity, utilization, seasonality, product allocation, and realized prices; monthly calculations convert the shared truck capacity into volumes and revenue by category.
Adjust revenue-linked costs, recurring monthly expenses, staffing FTE, and role salaries to see how product costs, route overhead, and paid service capacity affect operating earnings.
Schedule vehicle and equipment investment separately from owner contributions and any financing entered through Dashboard debt controls; supporting schedules track asset spending and debt repayment.
Review the selected scenario through Dashboard, IS, CF, BS, and Summary, with Checks supporting reconciliation and input review; these report capabilities extend beyond the supplied EBITDA illustration.
Monthly sold treats equal service days multiplied by practical daily capacity, annual utilization, and the monthly seasonal multiplier.
The case uses 22 service days per month and a practical maximum of 200 treats per day. Annual utilization rises from 45% in 2026 to 65% in 2030 in five-percentage-point steps, while prices and product shares stay flat.
Route sales and booked events draw from the same service pool, with no separate demand forecast added. Four product shares are entered directly, and sundaes receive the residual, keeping allocation at 100%.
The Revenue Forecast connects editable service capacity and seasonal utilization to sold treats and category sales. Its shared-volume approach lets you assess whether higher sales require better utilization, a different product mix, or revised realized prices.
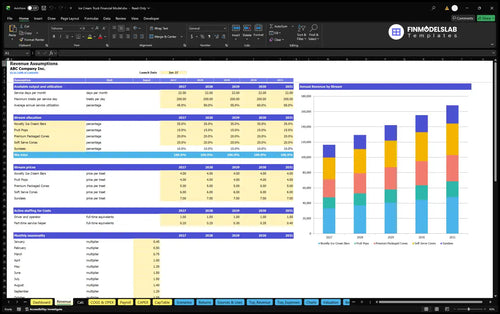
| Product category | Share of treats | Net price per treat |
|---|---|---|
| Novelty Ice Cream Bars | 35% | $4 |
| Fruit Pops | 15% | $4 |
| Premium Packaged Cones | 20% | $5 |
| Soft Serve Cones | 20% | $6 |
| Sundaes | 10% residual | $7 |
Estimated planning inputs; the weighted realized price is $4.90 per treat.
22 days/month × 200 treats/day × 45% utilization × 12.00 summed seasonal multipliers × $4.90/treat = $116,424 annual revenue.
The seasonal multipliers total 12.00, producing 23,760 sold treats in 2026. January uses 0.45, while June and July use 1.50; at 65% annual utilization, the 2030 summer peak reaches 97.5% of practical capacity.
Although the launch input is January 31, 2026, the calculation treats January as a full normal seasonal month. Revenue is zero before launch, and no partial-month proration is applied.
Operating expenses combine COGS, variable expenses, fixed overhead, and Payroll, with each payment counted once.
The COGS and Operating Expenses forecast separates direct, variable, and fixed costs. Frozen products and ingredients use 29% of revenue, disposables 2%, merchant processing 3%, event and location commissions 4%, and generator operating energy 1.5%.
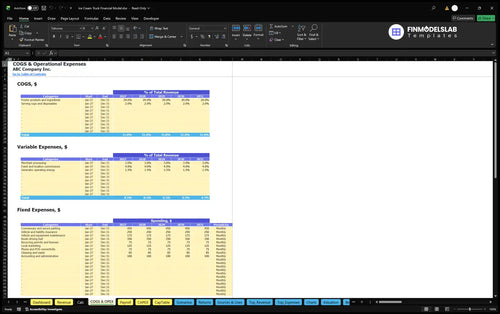
Annual fixed expenses total $20,220, covering commissary and parking, insurance, maintenance, route fuel, permits, marketing, connectivity, cleaning, and administration. The commissary and secure-parking input is $450 per month for 12 paid months.
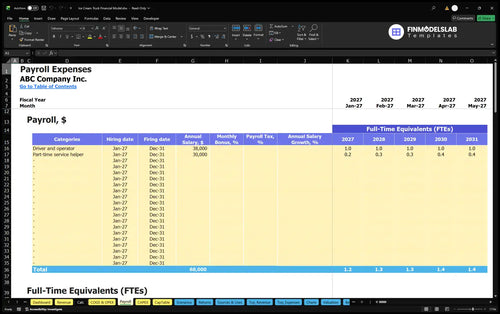
The Payroll Forecast tracks staffing FTE and fixed salaries by role. One working owner/operator receives $38,000 annually, while the helper rises from 0.20 FTE in 2026 to 0.40 in 2030 at $30,000 per full-time equivalent, taking annual payroll from $44,000 to $50,000.
Startup planning separates durable assets, distinct prelaunch cash items, opening inventory, and a recurring-expense reserve.
The Capital Expenditure Plan schedules asset purchases and depreciation. Documented inputs include a $45,000 used truck, $15,000 soft serve machine, $4,000 freezers, and $8,000 generator installation, with additional sanitary fitout, durable branding, and POS hardware.
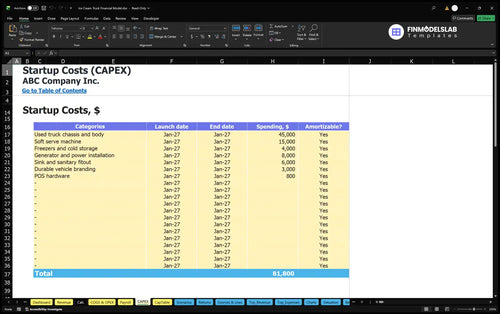
Separate opening cash items cover permits and setup, a commissary deposit, prelaunch marketing, and training and commissioning. Estimated owner funding is $114,863, including assets, those cash items, January physical opening stock, and three months of recurring cash expenses.
Sources and Uses of Funds reconciles receipts, equity, debt, payments, investment, and retained cash over a selected period. Use it to distinguish owner contributions from sales and identify where opening funding is allocated.
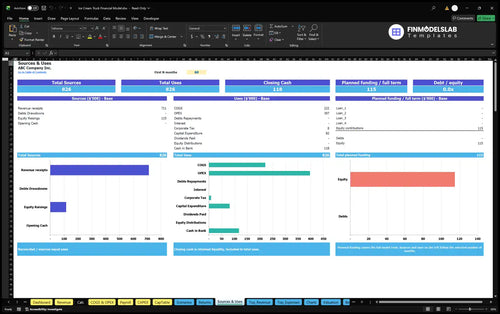
Working-capital controls are zero accounts-receivable days, zero accounts-payable days, and 14 inventory days. The funding amount is an estimated planning reserve with no committed external funding; peak cash needs have not been tested.
The supplied forecast shows higher utilization increasing revenue while annual fixed overhead stays unchanged and helper staffing expands.
| Year | Revenue | Operating Expenses | EBITDA |
|---|---|---|---|
| 2026 | $116,424 | $110,207 | $6,217 |
| 2027 | $129,360 | $116,817 | $12,543 |
| 2028 | $142,296 | $123,427 | $18,869 |
| 2029 | $155,232 | $130,037 | $25,195 |
| 2030 | $168,168 | $136,646 | $31,522 |
Source: supplied model case; amounts rounded to whole dollars, so displayed subtraction may differ by $1.
Operating expenses include COGS, variable expenses, fixed overhead, and payroll; startup asset spending and owner contributions are separate. EBITDA rises from $6,217 in 2026 to $31,522 in 2030, but these projections do not establish net profit or available cash.
The Cash Flow Forecast separates operating receipts and payments, asset spending, and financing movements. Review monthly closing cash alongside the Balance Sheet’s negative-cash alert when changing inventory or funding dates; the supplied case does not establish cash balances or funding sufficiency.
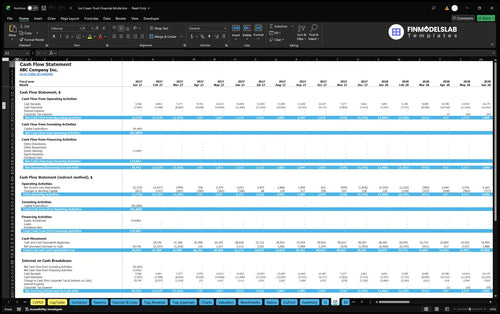
The Returns report supports operating-cost coverage, cash timing, investment recovery, and invested-capital analysis as separate measures.
The Returns report separates sales break-even, cash break-even timing, investment payback, and annual return on invested capital (ROIC). Sales break-even concerns revenue needed to cover operating costs; cash break-even concerns cash coverage, payback concerns recovery of invested funds, and ROIC measures returns against invested capital.
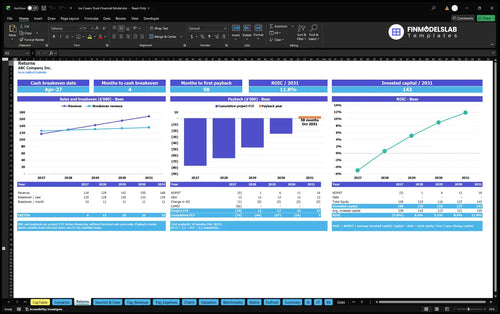
Use project cash flows and invested-capital schedules to evaluate these measures after changing vehicle spending and funding. Positive EBITDA alone does not establish payback or ROIC, and no numerical return result is supplied for this case.
Dashboard scenario controls apply Low, Base, and High multipliers to revenue, COGS, variable expenses, fixed expenses, and payroll. The Scenarios report compares revenue and profitability, helping assess weaker trading or higher costs without assuming an additional truck.
The case fits one mobile operation combining packaged treats and a soft-serve window, without a retail storefront or franchise royalties.
The US pass-through planning case uses estimated selections, not measured Raleigh-Durham averages. Replace capacity, seasonality, prices, and costs with your own operating assumptions; multiple trucks, storefront operations, or franchise fees require corresponding changes to the planning structure.
These answers clarify the editable assumptions, revenue structure, and limits of the illustrated financial projections.
Yes; the Revenue inputs support changes to service days, treat capacity, utilization, monthly seasonal multipliers, category shares, realized prices, and launch timing.
No; routes and booked events share one sold-treat pool allocated across five product categories, so the case does not add an independent event-demand forecast.
Yes; the working owner/operator’s $38,000 annual base salary is included in Payroll, and the part-time helper is paid separately.
No; it is an estimated reserve covering opening assets, distinct prelaunch cash, stock, and three months of recurring expenses, with peak cash requirements untested.
No; EBITDA excludes investment and financing cash flows, while payback depends on project cash flows and recovery of invested funds.
No; the 2026–2030 figures are illustrative projections from estimated planning assumptions for one Raleigh-Durham truck, not historical results or observed regional averages.
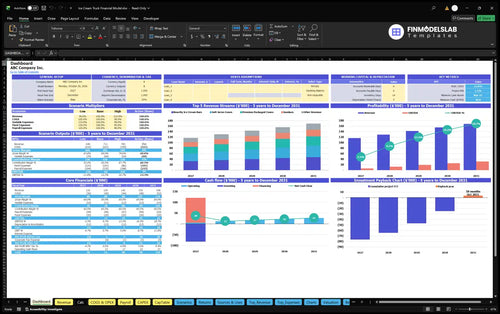
KPIs, forecasts, and cash flow at a glance.
Key assumptions and calculations driving revenue forecasts.
Funding sources, spending, and closing cash.
Cash break-even, payback, and ROIC.
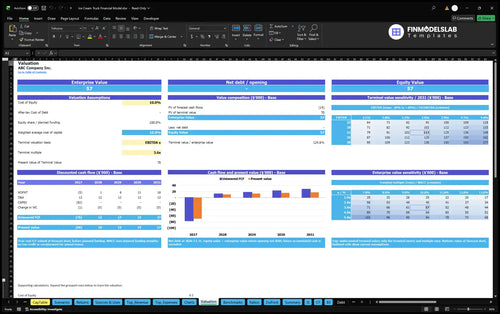
DCF valuation and sensitivity analysis.
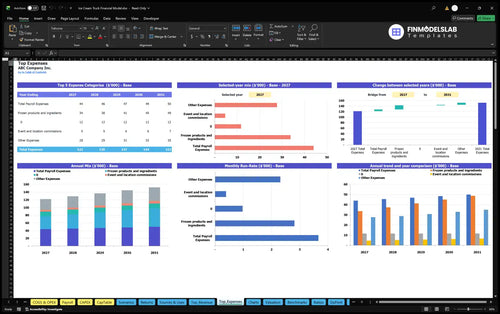
Largest costs and spending trends.
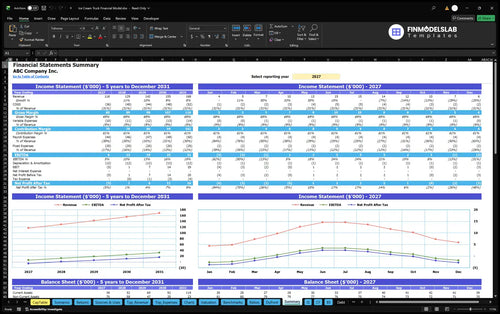
Annual and monthly financial performance.
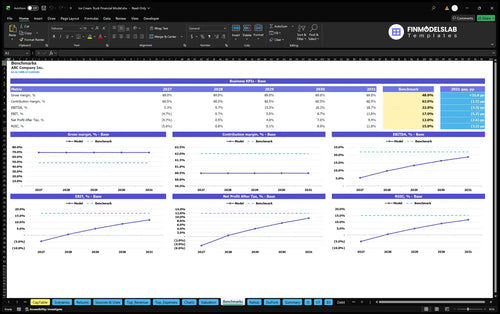
Compare margins and returns to benchmarks.

I stopped building the model from scratch and got my ice cream truck projections together much faster. What used to eat up a full weekend was done in a few hours, and I could move on to planning.

The pricing, costs, and growth tabs finally felt organized instead of scattered across my spreadsheet. That made it easier to talk through the numbers and get a planning meeting on the calendar.
I’m not deep into Excel, so the guided layout was a big relief. I could fill it in without getting lost in formulas and had a clean model ready to share.