

Revenue & Calc
Set launch timing, capacity, monthly seasonality, utilization, product shares and yields; monthly calculations consolidate five revenue streams without allocating the same capacity twice.


The Ice Skating Rink Financial Model is an Excel template for planning revenue, operating costs and EBITDA for a year-round indoor rink. Its 2026–2030 illustration models one 200-by-85-foot ice sheet in an approximately 30,000-square-foot equipped leased arena in a US Midwest suburban market.
Edit capacity, utilization, seasonality, the mix of five exclusive products, realized prices, staffing and startup spending to build financial projections. The example assumes the landlord supplies the operating refrigeration plant, slab, boards, locker rooms and installed HVAC.
The workbook combines operating inputs with financial statements, funding schedules and decision reports.
Set launch timing, capacity, monthly seasonality, utilization, product shares and yields; monthly calculations consolidate five revenue streams without allocating the same capacity twice.
Adjust revenue-linked supplies and transaction costs, fixed facility expenses and role-level staffing to see their effect on operating earnings.
Schedule asset purchases and owner contributions, then evaluate financing through the Dashboard debt controls and Debt schedules if funding assumptions are entered.
Review scenario controls, IS, CF, BS, Summary and reconciliation alerts together; the supplied rink case documents numeric operating results through EBITDA.
Revenue comes from sold rink-hour equivalents allocated once across public skating, pass redemptions, lessons, hockey rentals and private events.
Each of the 12 daily one-hour blocks includes 50 skating minutes and 10 minutes for resurfacing or turnover. Thirty average operating days per month provide 4,320 annual blocks; utilization increases from 42% in 2026 to 62% in 2030.
The Revenue Forecast connects available blocks, utilization and January–December seasonality with revenue by stream. Monthly multipliers range from 0.70 to 1.20 and total 12; product shares total 100%, preventing duplicated capacity.
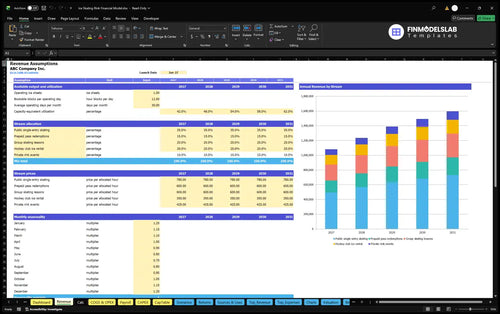
| Product | Pool share | Hourly yield | Yield basis |
|---|---|---|---|
| Public single-entry skating | 35% | $780 | 60 visits × $13 |
| Prepaid pass redemptions | 15% | $600 | 60 redemptions × $10 |
| Group skating lessons | 20% | $600 | 30 learners × $20 |
| Hockey club ice rental | 20% | $350 | Exclusive block |
| Private rink events | 10% | $425 | Exclusive block |
Public, pass and lesson yields include rental skates; participant counts explain the allocated yield rather than adding another demand forecast.
4,320 blocks × 42% utilization × $595.50 weighted yield = approximately $1,080,475 annual revenue.
Direct and variable costs scale with revenue, while fixed expenses and base salaries remain unchanged in the illustrated case.
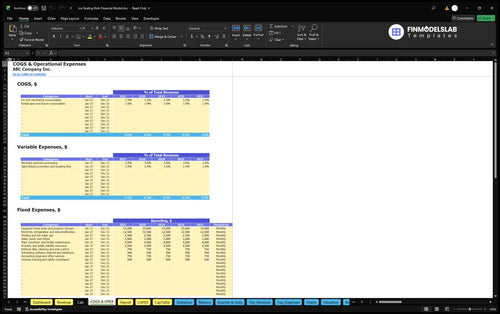
COGS equals 2.5% of revenue: 1.5% for ice and resurfacing consumables plus 1% for rental gear and lesson supplies. Variable expenses add 4.5%: 3% payment processing and 1.5% sales-linked promotion and booking fees.
The COGS and Operating Expense Forecast separates direct supplies, transaction-linked costs and fixed facility spending. Annual fixed expenses total $480,000, including the $15,000 monthly equipped arena lease and property charges; refrigeration electricity, gas, water, maintenance and insurance are also within that annual total.
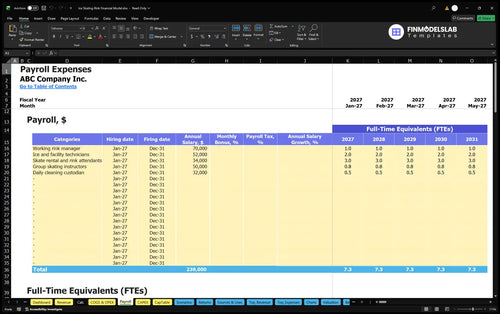
| Role | FTE | Annual base per FTE |
|---|---|---|
| Working rink manager | 1 | $70,000 |
| Ice and facility technicians | 2 | $52,000 |
| Skate rental and rink attendants | 3 | $34,000 |
| Group skating instructors | 0.75 | $50,000 |
| Daily cleaning custodian | 0.5 | $32,000 |
The Payroll Forecast calculates personnel expense from role-level FTE and base pay. The case uses 7.25 annual-average FTE and $329,500 in annual salaries, counted once in Payroll; employer taxes, benefits and personal taxes are excluded.
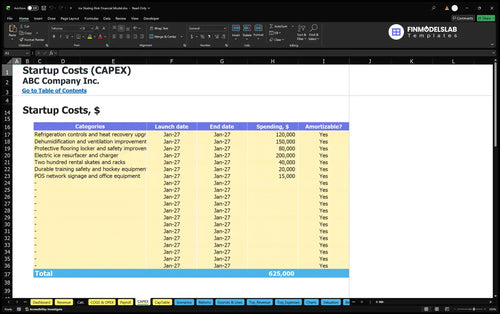
The estimated $962,613 owner contribution covers startup assets, separate prelaunch cash, opening working capital and an operating reserve.
The Capital Expenditure Plan schedules equipment spending and tracks depreciation for depreciable assets. Refrigeration controls, ventilation improvements, protective flooring and the electric resurfacer total $550,000; rental skates, training equipment and POS assets are additional startup items.
Separate preopening cash includes refundable deposits, commissioning, permits, launch marketing, preopening pay and ice-making energy. Working-capital controls are 2 receivable days, 30 payable days and 45 inventory days.
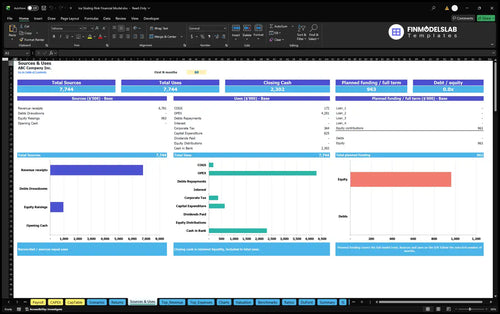
Sources and Uses of Funds reconciles funding sources with cash allocation over a selected period. The case includes no confirmed non-owner funding; its reserve covers three months of first-year recurring operating cash outflows as a planning policy, not a tested peak cash requirement.
The estimated operating case projects revenue and expenses through EBITDA for each calendar year from 2026 to 2030.
| Year | Revenue | Operating Expenses | EBITDA |
|---|---|---|---|
| 2026 | $1,080,475 | $885,133 | $195,342 |
| 2027 | $1,234,829 | $895,938 | $338,891 |
| 2028 | $1,389,182 | $906,743 | $482,440 |
| 2029 | $1,492,085 | $913,946 | $578,139 |
| 2030 | $1,594,987 | $921,149 | $673,838 |
Illustrative projections, not historical results or industry averages; whole-dollar rounding can cause small differences between displayed totals.
Growth comes from higher utilization with unchanged product mix and yields, while fixed expenses and payroll stay flat. EBITDA rises from $195,342 to $673,838 under those assumptions; this operating result excludes depreciation, interest and tax and does not establish net profit.
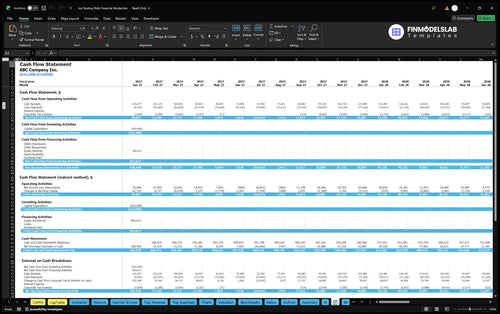
The Cash Flow Forecast separates operating receipts and payments from asset purchases, equity contributions and debt flows. Use it to evaluate liquidity and payment timing; the illustrated EBITDA figures do not establish closing cash balances or cash sufficiency.
The Returns report supports distinct assessments of operating cost coverage, cash timing, investment recovery and annual capital efficiency.
The Returns report compares sales with break-even requirements and tracks cash break-even, investment payback and annual ROIC. Sales break-even measures operating cost coverage; cash break-even concerns cash timing, payback concerns cumulative project cash recovery, and annual ROIC measures returns on invested capital.
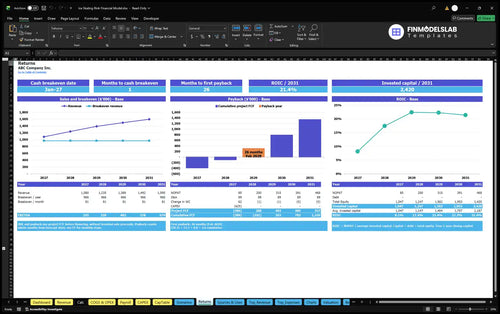
Use Dashboard Low, Base and High multipliers for revenue, COGS, variable expenses, fixed expenses and payroll to compare operating profitability. Return values require the relevant cash-flow and invested-capital calculations; no payback date or ROIC result is supplied for this illustration.
This template fits a commercial rink combining scheduled public skating with lessons and exclusive ice rentals.
The case excludes land acquisition, new arena construction, unlimited memberships, separately charged skate rentals, concessions, pro-shop sales, sponsorship and spectator tickets. Operators planning those activities should adapt the revenue structure, capacity allocation and startup budget before relying on the projections.
These answers clarify the editable inputs and the scope of the supplied operating case.
Edit launch timing, ice capacity, bookable blocks, operating days, utilization, seasonality, product shares and yields, alongside cost, staffing and startup assumptions.
The documented revenue stream uses prepaid ten-visit pass redemptions at a $10 per-visit yield, so redemptions should not be treated as a separate forecast of pass cash collections.
Yes, rental skates are included in public single-entry, pass-redemption and lesson yields; the case has no separate skate-rental revenue stream.
No, the inputs are estimated planning selections and the outputs are illustrative projections, not observed industry averages.
No, the estimated $962,613 owner contribution is funding for startup and opening cash needs, separate from recurring operating expenses and EBITDA.
No, cash sufficiency depends on collection and payment timing, asset purchases and financing flows, so assess the cash flow reports rather than using EBITDA as a cash balance.
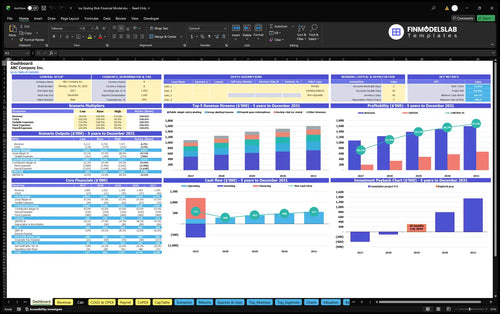
KPIs, forecasts, and cash flow at a glance.
Key assumptions and calculations driving revenue forecasts.
Funding sources, spending, and closing cash.
Cash break-even, payback, and ROIC.
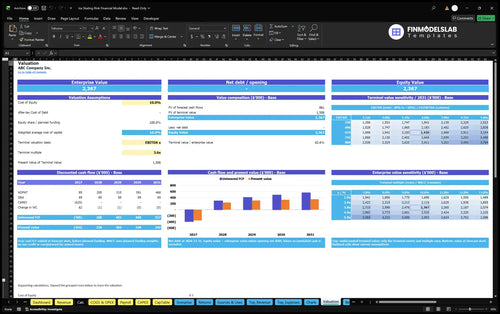
DCF valuation and sensitivity analysis.
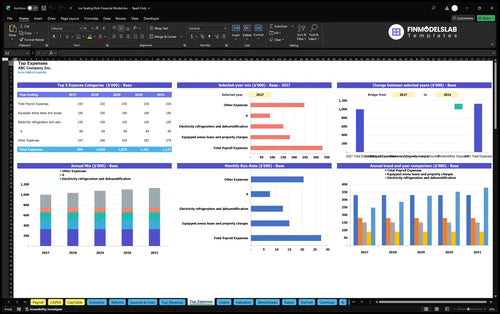
Largest costs and spending trends.
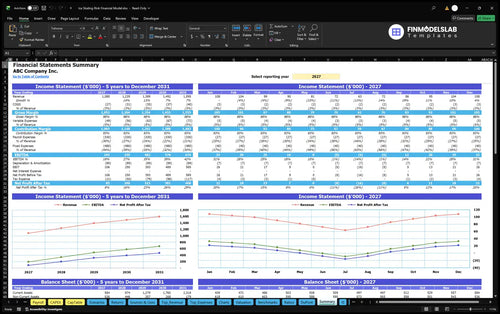
Annual and monthly financial performance.
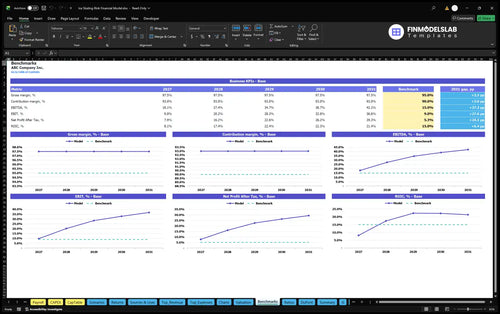
Compare margins and returns to benchmarks.

This template cut my build time from a full weekend to an afternoon, so I could focus on site planning instead of wrestling with formulas.

I used the low, base, and high cases without rebuilding anything three times, and it made my planning meeting much easier to run. One clean sheet kept the options clear.
The margin and break-even tabs made the numbers finally click, and I walked into my lender call with a much clearer answer on profitability.