

Activate Resources
Set practitioner categories, resource counts, and opening dates that determine available capacity.


This editable workbook models practitioner counts, treatment capacity, utilization, and service pricing across a five-year forecast with linked statements and scenarios.
Use the model to plan how practitioner availability and monthly treatment capacity can translate into service volume and clinic revenue.
Editable resource counts, opening dates, utilization, prices, costs, staffing, capital, and scenario assumptions flow through monthly calculations into financial statements and management reports.
It calculates service volume from available practitioners, monthly treatment capacity, and utilization, then applies service pricing and active months before summing revenue.
Set practitioner categories, resource counts, and opening dates that determine available capacity.
Multiply active resources by maximum monthly treatments per resource for each service stream.
Multiply maximum treatment capacity by the utilization percentage or ramp for expected treatments.
Multiply expected treatments by average realized price and active months for each service line.
Sum calculated revenue across all enabled practitioner and service streams.
The Revenue worksheet sets practitioner counts, launch dates, maximum monthly treatments, utilization, and average service prices that drive clinic revenue.
 REVENUE
The COGS & OPEX worksheet separates revenue-linked treatment costs, variable expenses, and fixed clinic overhead across the forecast.
 COGS & OPEX
The Scenarios view compares Low, Base, and High paths for revenue, gross margin, contribution margin, and EBITDA across five years.
 SCENARIOS
The Dashboard combines setup controls, scenario multipliers, financial metrics, revenue composition, profitability, cash flow, and investment payback in one management view.
 DASHBOARD
It fits clinics where treatment revenue is constrained by practitioner capacity and utilization; structurally different revenue logic or reporting may call for custom modeling.
The template is a planning starting point, not a guarantee of performance.
Financial Models Lab can build or adapt a model when you need different revenue logic, operating schedules, financing mechanics, or reporting.
ORDER A CUSTOM FINANCIAL MODELYou receive an editable financial-model workbook for immediate download, with five-year projections, scenario analysis, and linked financial and management reports.
Change practitioner counts, opening dates, treatment capacity, utilization, prices, costs, staffing, and other model inputs.
Review monthly and annual projections across the five-year planning horizon.
Compare Low, Base, and High cases through the workbook’s scenario controls and reports.
Inspect linked income statement, cash flow, balance sheet, dashboard, and supporting reports.
The essential answers are visible in full, with no accordion clicks required.
It calculates expected treatments from practitioner counts, monthly treatment capacity, and utilization, then applies service pricing and active months and sums enabled streams.
You can change practitioner categories, resource counts, opening dates, maximum monthly treatments, utilization, service prices, active months, and service-line definitions.
They compare alternative paths for revenue, gross margin, contribution margin, and EBITDA under the model’s scenario multipliers.
The current product shows income statement, cash flow, balance sheet, Dashboard, Summary, break-even, valuation, ROIC, KPI, ratio, and other management reports.
Yes. Financial Models Lab can build or adapt revenue logic, operating schedules, financing structures, and reporting around an agreed custom scope.
It is an editable planning forecast driven by assumptions, not a guarantee of business performance, profitability, financing, or returns.
This downloadable excel financial model for medical practice provides the insights of a professional consultant at a fraction of the cost. By leveraging our pre-built formulas, frameworks, and industry-specific assumptions, you can create a comprehensive financial plan in hours, not weeks. It's a budget-friendly tool that saves you thousands in consulting fees and accelerates your path to launch.
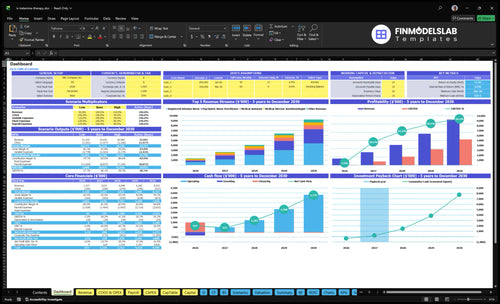
Core inputs and core outputs

Three scenario analysis

Presentation ready
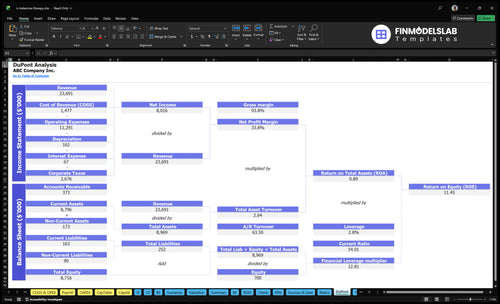
DuPont analysis
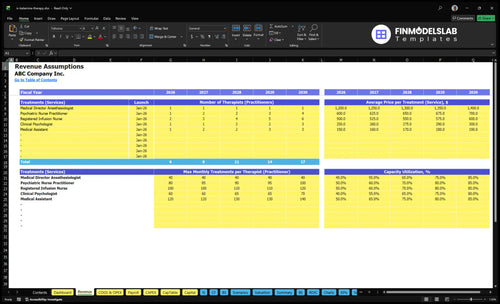
Researched revenue assumptions
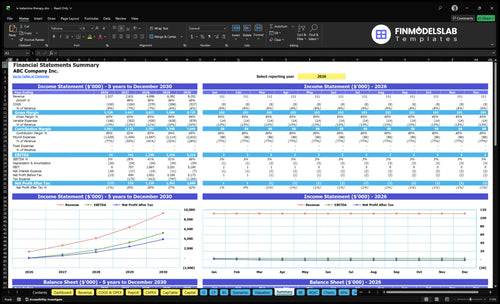
Lender-friendly financial outputs
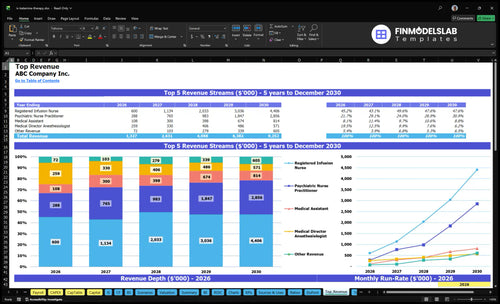
Revenue stream detailed view

Performance metrics benchmark

This template saved me from staring at a blank spreadsheet for hours. I had a working model for the clinic the same afternoon, which made the first planning meeting much easier to start.
I used to get stuck comparing low, base, and high cases by hand. With this model, I sorted the assumptions in one place and cut scenario prep down by a few hours.
It made the margin picture much easier to read, especially around staffing and session volume. I could see break-even more clearly and use that in a lender conversation without rebuilding the math.