

Revenue & Calc
Set annual order levels, category shares, prices, seasonality, and launch timing; monthly calculations consolidate the five product streams into the revenue forecast.


The Jewelry Making Financial Model is an Excel template for projecting handcrafted sterling-silver and gemstone jewelry sales, operating expenses, and EBITDA over 2026–2030. Edit customer orders, product mix, realized prices, staffing, and costs to assess the economics of a direct-to-consumer jewelry business.
The illustrated case uses an owner-managed, 400-square-foot leased US studio selling prepaid, single-piece orders through Shopify. It includes paid owner labor and a January 31, 2026 launch, with a full normal launch month under the model’s timing convention.
Connected inputs and reports let you trace jewelry demand through operating earnings and review the broader financing implications.
Set annual order levels, category shares, prices, seasonality, and launch timing; monthly calculations consolidate the five product streams into the revenue forecast.
Separate materials and selling costs from fixed overhead, paid staffing, and equipment purchases so recurring expenses and opening investments remain identifiable.
Adjust Low, Base, and High multipliers for revenue and each operating cost group, then compare revenue, margins, and EBITDA under the selected assumptions.
The workbook includes income statement, cash flow, balance sheet, Summary, and Checks reports; the illustrated figures on this page cover revenue, operating expenses, and EBITDA.
Revenue equals allocated prepaid orders multiplied by each category’s realized selling price.
Average monthly customer orders increase from 120 in 2026 to 350 in 2030. Four editable shares allocate earrings, necklaces, bracelets, and rings; personalized pendants receive the calculated remainder, 10% in this example, so one demand pool is allocated once.
The repeating monthly seasonality profile averages 100%, including January at 70%, November at 145%, and December at 170%. Each order contains one sold piece; realized prices reflect ordinary discounts and exclude sales tax.
The Revenue Forecast connects order demand, category mix, realized prices, and launch timing to monthly and annual sales. Year-specific order and price inputs drive the five-year ramp; staffing supports expense planning without limiting modeled sales.
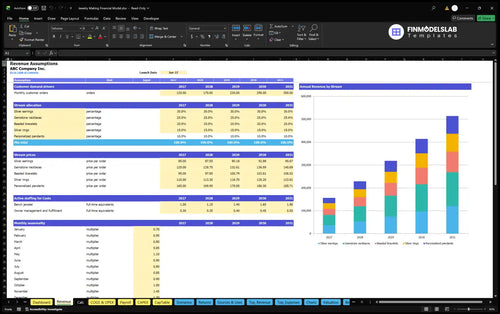
| Product category | Order share | Price per piece |
|---|---|---|
| Silver earrings | 30% | $85 |
| Gemstone necklaces | 25% | $125 |
| Beaded bracelets | 20% | $95 |
| Silver rings | 15% | $110 |
| Personalized pendants | 10% | $165 |
Selected planning assumptions; the pendant share is the calculated remainder.
120 average monthly orders × 12 months × $108.75 weighted realized price = $156,600 revenue.
Revenue-based costs, monthly fixed expenses, and role-based payroll together determine operating EBITDA.
The COGS & Operating Expense Forecast organizes direct costs, variable selling expenses, and fixed studio overhead. Estimated direct costs total 29% of revenue: metals, beads, and gemstones at 25%, workshop consumables at 2%, and gift and shipping packaging at 2%.
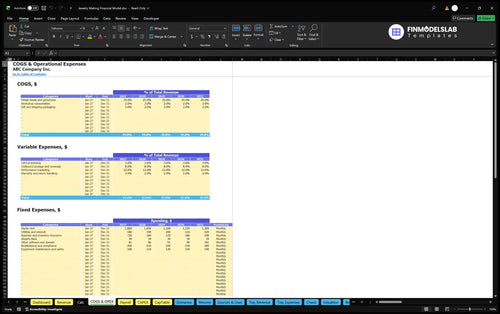
Variable expenses total 25.6% of revenue: card processing at 3.6%, outbound postage and coverage at 8%, performance marketing at 12%, and warranty and return handling at 2%. These percentages scale spending with modeled sales.
Fixed expenses include rent, utilities, insurance, Shopify Basic, other software, bookkeeping, and equipment maintenance and safety. Rent rises from $1,000 monthly in 2026 to $1,200 in 2030, with 12 paid months; total fixed expenses rise from $21,000 to $25,560 annually.
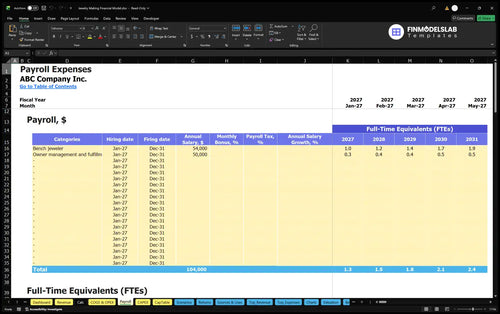
The Payroll Forecast calculates personnel expenses from annual-average FTE and fixed base pay. Bench-jeweler staffing rises from 1.0 FTE in 2026 to 1.9 in 2030 at $54,000 per FTE annually.
Owner management and fulfillment rises from 0.3 to 0.5 FTE at $50,000 per FTE annually. Total payroll increases from $69,000 to $127,600; these salaries are counted only in Payroll.
The case separates durable startup assets, other opening cash requirements, inventory, and an operating reserve.
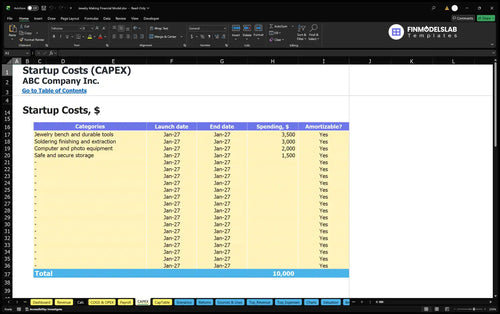
The Capital Expenditure Plan schedules equipment purchases and depreciation where applicable. The selected startup assets total $10,000: bench and tools at $3,500, soldering and extraction at $3,000, computer and photography equipment at $2,000, and secure storage at $1,500.
Separate startup cash covers the studio deposit, registration and permits, prelaunch photography and marketing, and safety setup and training. Working-capital controls use zero receivable days, zero payable days, and 60 inventory days, reflecting prepaid customer orders and materials paid before shipment.
The Sources and Uses of Funds report reconciles funding sources and cash allocation over a selected period. The $66,591 owner-funding target is estimated from qualifying assets, other startup cash, opening inventory, and a three-month operating reserve; this case uses no non-owner financing.

The selected assumptions produce an initial EBITDA loss followed by positive annual EBITDA from 2027.
| Year | Revenue | Operating Expenses | EBITDA |
|---|---|---|---|
| 2026 | $156,600 | $175,504 | -$18,904 |
| 2027 | $228,506 | $226,504 | $2,002 |
| 2028 | $318,434 | $292,745 | $25,689 |
| 2029 | $413,541 | $361,813 | $51,727 |
| 2030 | $514,080 | $433,848 | $80,232 |
Illustrative projections, rounded to whole dollars using original calculation precision; displayed figures may differ slightly when subtracted.
Revenue growth combines higher order demand with year-specific realized prices while payroll and studio overhead also increase. Operating expenses include COGS, variable expenses, fixed expenses, and Payroll; these results are planning outputs, not historical performance or industry averages.
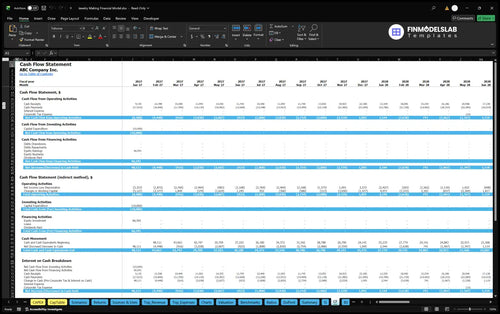
The Cash Flow Forecast separates operating, investing, and financing cash movements and reconciles opening to closing cash. Use it to examine inventory purchases, equipment spending, and owner contributions; the supplied EBITDA figures do not establish cash sufficiency or net profit.
The Returns report distinguishes operating cost coverage from cash timing and recovery of invested capital.
The Return on Invested Capital Analysis combines sales break-even, cash break-even, investment payback, and annual ROIC. These measures help evaluate whether jewelry pricing, order demand, staffing, and opening investment support the intended operating and investment outcomes.
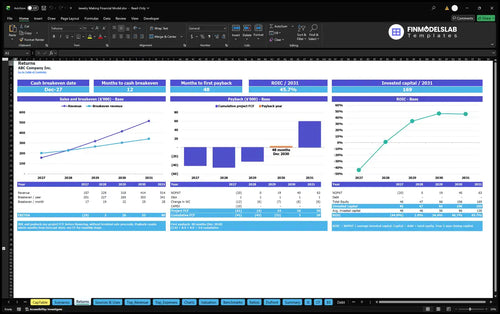
Sales break-even compares revenue with operating cost coverage; cash break-even examines cash timing. Investment payback tracks recovery through cumulative project free cash flow, while annual ROIC measures returns relative to invested capital.
Positive EBITDA in 2027 does not establish cash break-even, investment payback, or a particular ROIC. Dashboard debt controls support financing schedules if financing is entered; no borrowing assumptions or return results are established for this owner-funded example.
This case suits a small US studio selling its own silver and gemstone pieces directly to domestic customers.
The documented operating scope excludes a retail storefront, wholesale, gold fine jewelry, and repairs. Order levels, prices, cost rates, staffing, and funding selections are estimates to adapt to your own plans; the references supplied with the case do not independently verify those selections.
These answers clarify the editable inputs, operating scope, and interpretation of projected results.
Edit year-specific monthly order levels, category shares, realized prices, seasonality, and launch timing; the remaining pendant share and monthly revenue calculations follow those selections.
No; owner management and fulfillment receives fixed compensation through Payroll based on annual-average FTE and a $50,000 annual base per FTE.
No; revenue follows the order-demand forecast, while staffing determines payroll costs rather than a production-capacity ceiling.
Yes; Dashboard scenario controls apply Low, Base, and High multipliers to revenue, COGS, variable expenses, fixed expenses, and payroll for comparison of operating profitability.
No; review the cash flow and funding schedules because inventory, equipment purchases, and financing cash movements differ from operating EBITDA.
No; they are estimated planning assumptions and illustrative projections for the selected studio, with numerical operating evidence limited to revenue, expenses, and EBITDA.
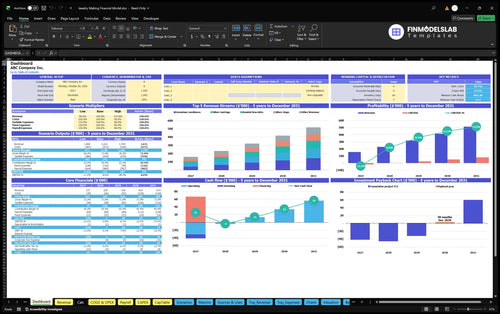
KPIs, forecasts, and cash flow at a glance.
Key assumptions and calculations driving revenue forecasts.
Funding sources, spending, and closing cash.
Cash break-even, payback, and ROIC.
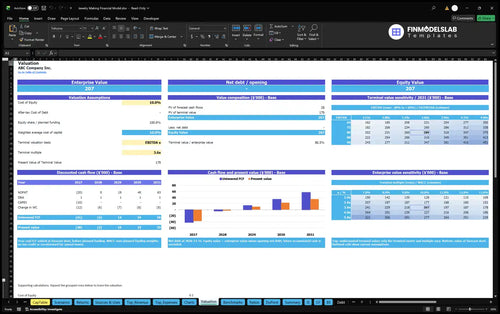
DCF valuation and sensitivity analysis.
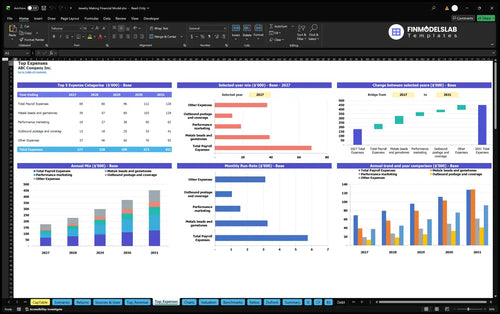
Largest costs and spending trends.
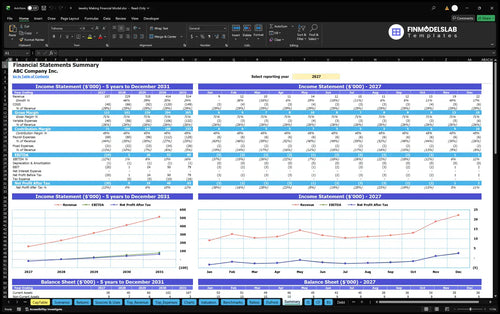
Annual and monthly financial performance.
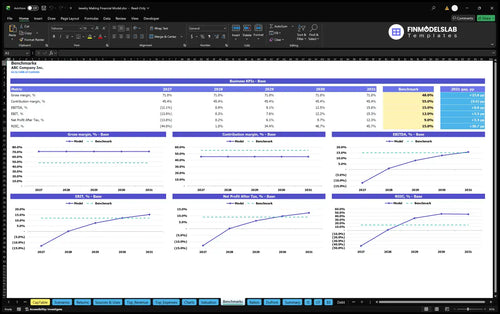
Compare margins and returns to benchmarks.

One broken cell used to throw off my whole model. This template kept the logic intact and saved me hours of fixing formula issues.

I wasn’t sure what investors expected to see, but this gave me the right structure right away. I booked a meeting faster because the outputs were already laid out clearly.
Pricing, material costs, and growth were all over the place before. Now they’re organized in one file, and I saved a full afternoon when updating my forecast.