

Revenue & Calc
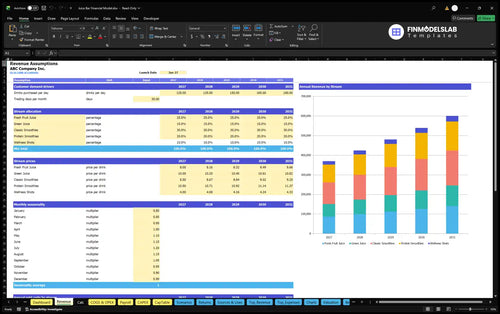
Adjust purchased drinks per day, trading days, the repeating seasonal pattern, category shares and source-year prices. Revenue inputs feed monthly calculations, with each drink allocated once.


The Juice Bar Financial Model is an Excel template that connects daily drink purchases, menu mix, prices and seasonality to five-year revenue, operating expenses and EBITDA. Its illustrative 2026–2030 case uses nominal US dollars for an independent, 900-square-foot juice and smoothie shop.
The case assumes leased second-generation food-service space in a mid-cost US suburban area, ten trading hours daily and payment at checkout. Selected assumptions are estimated planning inputs; the documented operating forecast ends at EBITDA.
Edit drink demand, category prices, costs, staffing and opening funding, then review the linked operating forecast and declared financial reports.
Adjust purchased drinks per day, trading days, the repeating seasonal pattern, category shares and source-year prices. Revenue inputs feed monthly calculations, with each drink allocated once.
COGS & OPEX separates revenue-linked spending from monthly fixed costs; Payroll plans FTE and annual base pay. CAPEX and CapTable record asset purchases and owner contributions separately.
Dashboard controls select Low, Base or High multipliers for revenue, COGS, variable costs, fixed costs and payroll. Compare changes in gross margin, contribution margin and EBITDA before adopting a revised plan.
Declared Income Statement, Cash Flow, Balance Sheet and Summary reports organize broader financial projections, while Checks identifies reconciliation and input issues. The supplied case establishes numeric operating results through EBITDA only.
The revenue forecast multiplies one pool of purchased drinks by menu allocation and annual category prices.
Purchased demand rises from 120 drinks per day in 2026 to 180 in 2030, with 30 trading days per month. Allocate 25% to fruit juice, 15% to green juice, 30% to classic smoothies, 20% to protein smoothies and the residual 10% to wellness shots.
The twelve repeating monthly seasonal factors sum to 12.0, producing 43,200 drinks in 2026. January’s factor is 0.80 and July’s is 1.20; launch on January 31, 2026 includes a full modeled January with no daily proration.
Revenue Forecast shows how operating inputs become monthly drink volume and sales by category. In 2026, prices of $8, $10, $8.50, $10.50 and $4 produce a $8.55 weighted menu price using the stated mix.
43,200 annual drinks × $8.55 weighted menu price = $369,360 annual revenue.
Ingredients, serving consumables and transaction-linked expenses scale with revenue; fixed occupancy costs and base salaries follow separate schedules.
COGS and Operating Expenses separates ingredients at 28% of revenue and consumables at 2.5% from processing at 4% and promotions at 2%. Fixed costs include occupancy, utilities, insurance, maintenance, cleaning, software, professional services, licenses, communications and waste collection.

Rent and occupancy starts at $3,000 per month for 12 paid months in 2026 and rises annually by 3%. Total annual fixed expenses increase from $60,840 in 2026 to $68,476 in 2030.
Payroll Forecast by Staff Role calculates personnel expenses from FTE and annual base salaries. One manager earns $58,000 annually; crew staffing increases from 3 to 4 annual-average FTE at $32,000 each, taking total payroll from $154,000 in 2026 to $186,000 in 2030.
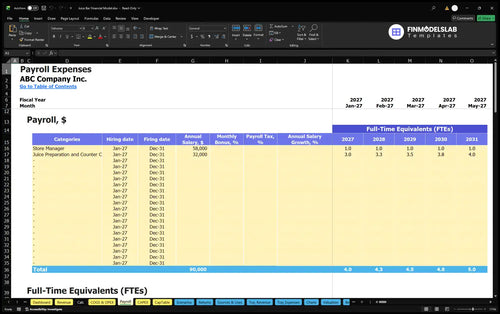
Base salaries appear only in Payroll, so direct, variable and fixed cost categories exclude them. Employer taxes, benefits and personal taxes are excluded from this operating case.
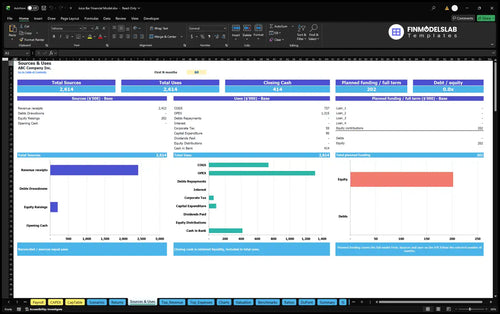
The estimated $202,009 owner contribution funds opening assets, preopening payments, net working capital and a three-month reserve, less confirmed non-owner funding.
Capital Expenditure Plan schedules asset purchases and depreciation separately from recurring operating expenses. Selected startup equipment includes $6,000 for juice extraction, $3,000 for blenders, $8,000 for refrigeration and freezers, and $4,000 for an ice machine and filtration.
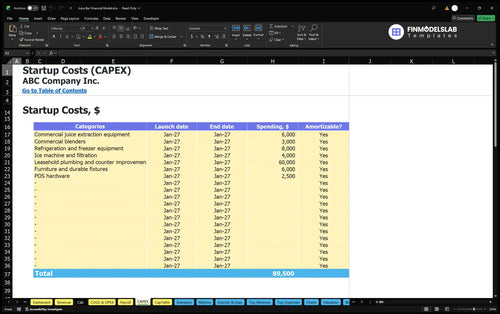
Other assets cover plumbing and counter improvements, furniture, durable fixtures and POS hardware. Separate preopening cash items cover permits, refundable deposits, launch marketing, training payroll and one-time legal and setup services.
Sources and Uses of Funds reconciles funding sources with cash allocation over selected forecast months. Owner funding is an opening financing input; any borrowing requires separate Dashboard debt assumptions and review of scheduled repayments.
Working-capital controls use 0 receivable days, 4 payable days and 7 inventory days. Checkout payment supports the zero-receivables assumption; inventory and supplier timing remain separate cash considerations.
The illustrative operating forecast increases revenue and EBITDA across all five years under the supplied demand, price and cost assumptions.
| Year | Revenue | Operating Expenses | EBITDA |
|---|---|---|---|
| 2026 | $369,360 | $349,656 | $19,704 |
| 2027 | $423,841 | $379,367 | $44,474 |
| 2028 | $480,168 | $409,806 | $70,362 |
| 2029 | $538,877 | $441,171 | $97,705 |
| 2030 | $599,724 | $473,375 | $126,349 |
Illustrative projections, not observed business results or industry averages; amounts are rounded to whole dollars, so displayed differences may vary by $1.
Revenue grows from $369,360 in 2026 to $599,724 in 2030 as daily demand rises and source-year menu prices increase. EBITDA grows from $19,704 to $126,349 after COGS, variable expenses, fixed costs and payroll.
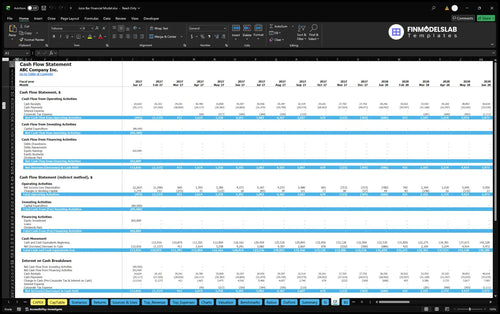
Cash Flow Forecast organizes operating receipts and payments, asset spending and financing flows to reconcile opening and closing cash. Review working capital, startup spending and funding in that report; the supplied EBITDA results do not establish cash sufficiency.
Use Returns to distinguish operating cost coverage, cash break-even, investment recovery and annual returns on invested capital.
Break-Even, Payback and ROIC evaluates sales break-even, cash break-even, cumulative project cash flow and annual return on invested capital. These report functions support investment review, but the supplied case provides no calculated payback dates or ROIC results.
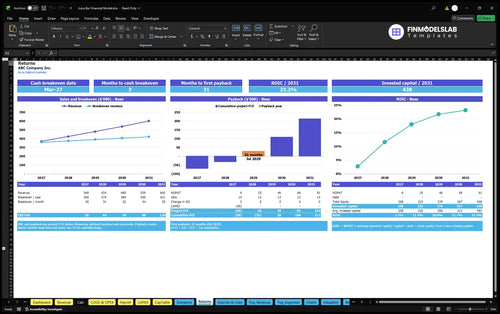
Sales break-even identifies revenue needed to cover operating costs; cash break-even addresses cash coverage. Investment payback tracks recovery of invested funds, while annual ROIC measures operating returns relative to invested capital.
This template helps plan an independent made-to-order juice and smoothie shop with one checkout-based drink-demand pool.
Use it to compare menu pricing, demand and staffing choices before committing to rent or equipment. The case excludes customer credit and delivery marketplaces and uses a general suburban occupancy assumption without a site-specific lease quote.
These answers clarify the inputs, scope and limits of the illustrated model.
Yes—edit daily purchased drinks, trading days, category shares, annual prices and seasonality to build a revenue forecast around your own planning assumptions.
The model includes a full January 2026 of activity, applying January seasonality without prorating the month to a single trading day.
No; selected inputs are estimates, and the referenced menu, labor and processing sources do not independently validate them.
No; asset purchases, working capital, financing and other cash movements require separate analysis in the Cash Flow report.
No; $202,009 is an estimated initial contribution based on the opening funding inputs, not a tested guarantee of sufficient cash.
Yes—the declared Dashboard debt controls, Debt schedules and Returns report support that analysis once financing and cash-flow assumptions are completed; no case-specific borrowing terms or payback result are supplied.
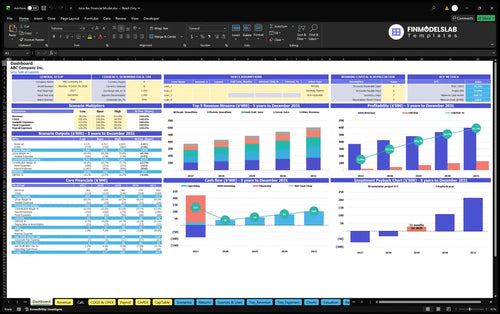
KPIs, forecasts, and cash flow at a glance.
Key assumptions and calculations driving revenue forecasts.
Funding sources, spending, and closing cash.
Cash break-even, payback, and ROIC.
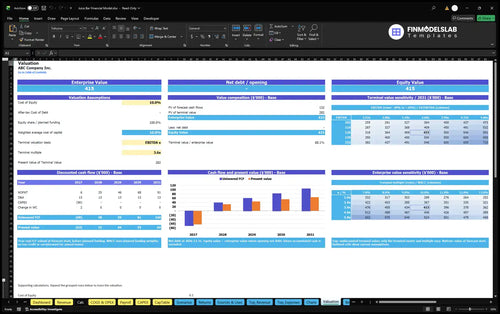
DCF valuation and sensitivity analysis.
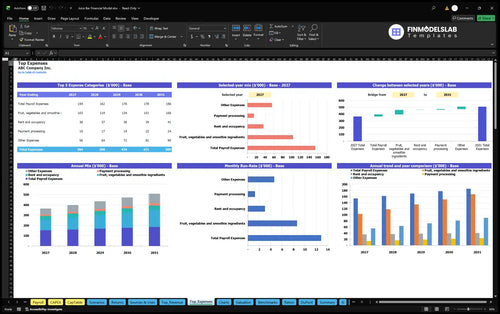
Largest costs and spending trends.
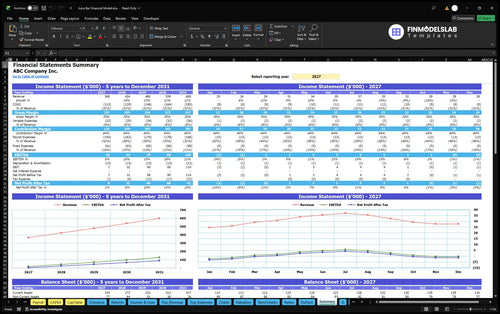
Annual and monthly financial performance.
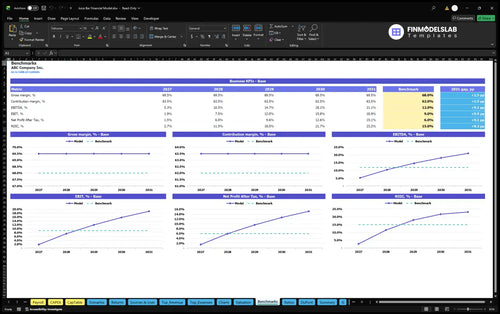
Compare margins and returns to benchmarks.

This template made runway and shortfall planning much easier, so I could spot a cash gap two months earlier and adjust my funding plan before it became a problem.

I liked how the model kept the logic clean and easy to follow, which cut down the stress of one broken cell throwing everything off. It was much easier to review assumptions without second-guessing the numbers.
I went from building projections by hand to having a usable model in one afternoon, which saved me at least 8 hours. It let me focus on the juice bar launch instead of wrestling spreadsheets.