

Define Products
Set the manufactured product lines and launch timing when applicable.


It is an editable five-year workbook for unit-driven steel framing revenue, monthly projections, scenario analysis, and linked financial statements and management reports.
Use the model to plan manufactured framing product volumes, unit pricing, costs, staffing, capital needs, and the financial effects of operating decisions over the forecast.
Editable assumptions feed the calculation engine, which links operating schedules to projected profit and loss, cash flow, balance sheet, scenarios, and dashboard reporting.
The model calculates each enabled product line from recognized units and its matching sales price, then adds enabled ancillary revenue and applies seasonality once.
Set the manufactured product lines and launch timing when applicable.
Enter produced, saleable, or sold units by product and period.
Assign the matching sales price per unit to each product line.
Allocate annual revenue through monthly seasonality once and include enabled ancillary revenue.
Sum recognized product-line sales plus any separately enabled ancillary revenue.
The Revenue Setup view organizes product lines, launch timing, units produced, sales prices, seasonality, and the resulting product-line revenue forecast.
 REVENUE SETUP
The OPEX worksheet organizes recurring operating expense categories and editable cost drivers across the forecast for overhead and operating-cost planning.
 OPEX
The Scenario Analysis view compares Low, Base, and High outcomes for revenue, gross margin, contribution margin, and EBITDA across the five-year forecast.
 SCENARIO ANALYSIS
The Dashboard combines setup controls, scenario multipliers, core financials, revenue mix, profitability, cash flow, and investment payback charts in one view.
 DASHBOARD
The template fits product-line manufacturing economics; consider custom modeling when your revenue recognition, production schedules, or reporting structure materially differ.
The template is a planning starting point, not a guarantee of performance.
Financial Models Lab can build or adapt a model when your revenue logic, operating schedules, or reporting requirements need a different structure.
ORDER A CUSTOM FINANCIAL MODELAfter checkout, you receive an editable Excel and Google Sheets model with five-year projections, scenario analysis, and financial reports as an instant download.
Update business assumptions, operating drivers, and model inputs for your own plan.
Review the five-year projection with monthly detail available for financial planning.
Compare Low, Base, and High cases through the built-in scenario view.
Use the projected P&L, cash flow, balance sheet, dashboard, and related reports.
The essential answers are visible in full, with no accordion clicks required.
It calculates enabled product-line revenue from recognized units multiplied by matching sales prices, then adds enabled ancillary revenue. Annual inputs flow through seasonality once when the model allocates them monthly.
You can edit product-line names, launch timing where applicable, unit volumes, sales prices, seasonality, sell-through or inventory conventions when shown, and enabled ancillary revenue.
It lets you compare Low, Base, and High outcomes across revenue, gross margin, contribution margin, and EBITDA. The scenario view shows how alternative assumptions change the forecast path.
The product page confirms five-year P&L, cash flow, balance sheet, dashboard, and scenario outputs. Additional gallery views include summary, valuation, break-even, ROIC, charts, ratios, and other reports.
Yes. Financial Models Lab offers custom financial modeling when different revenue logic, operating schedules, or reporting structures are required.
It is a planning forecast based on editable assumptions, not a guarantee of business performance. Actual results will depend on the inputs and real operating conditions.
This comprehensive light gauge steel framing business plan excel template provides everything you need to build a solid financial foundation for your venture.

Core inputs and core outputs
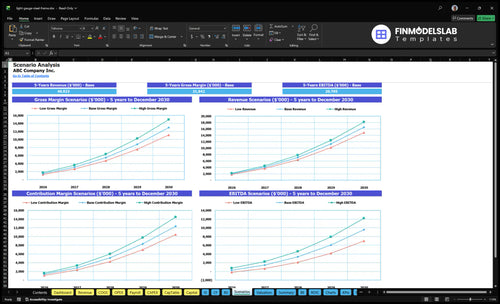
Three scenario analysis

Presentation ready
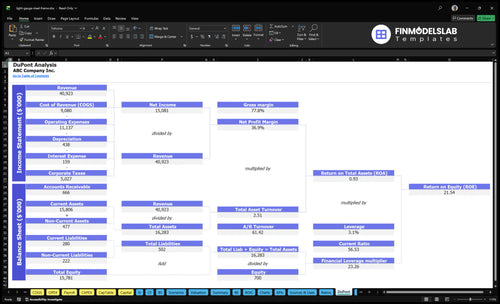
DuPont analysis
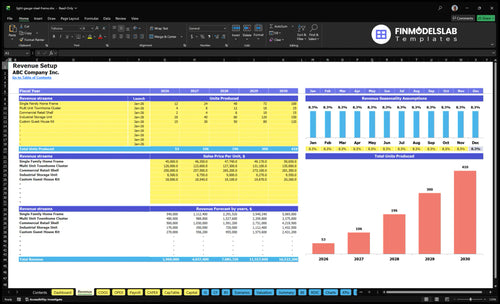
Researched revenue assumptions

Lender-friendly financial outputs
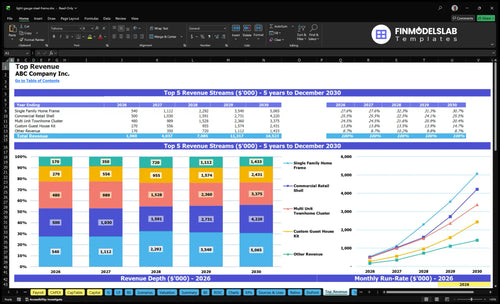
Revenue stream detailed view

Performance metrics benchmark

One broken formula can throw the whole model off, but this template kept everything linked cleanly. I saved hours of troubleshooting and could review the numbers without second-guessing every cell.

I used to struggle with runway and shortfalls, but this made the cash flow picture easy to follow. It helped me spot a funding gap early and get a planning meeting booked faster.
Pricing, labor, and growth assumptions were all over the place before. This template gave me a cleaner structure, and I cut my setup time by half while finally being able to explain each number.