

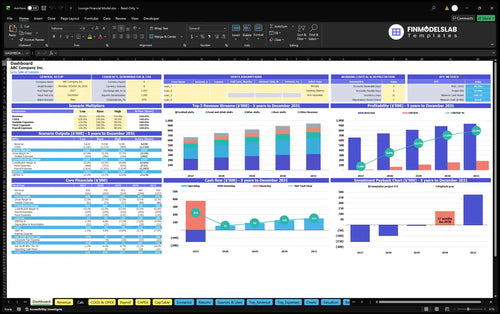
Financial Dashboard
KPIs, forecasts, and cash flow at a glance.


This Lounge Financial Model is an Excel template for a 60-seat cocktail lounge with light food in Dallas, Texas. Revenue is driven by seat capacity, two potential turns per service day, 26 service days per month, utilization, visit mix, and complete net ticket prices.
The illustrated case runs from 2026 through 2030 and separates purchased ingredients, other variable expenses, fixed operating costs, and Payroll. Startup assets, preopening cash items, working-capital inputs, equity funding, and operating EBITDA are modeled as distinct concepts.
The workbook links lounge operating assumptions to monthly calculations, financial statements, funding schedules, management reports, and model checks.
Revenue inputs define capacity, utilization, exclusive visit categories, launch timing, and annual prices. Calc converts those assumptions into monthly operating volumes and sales.
COGS & OPEX separates direct ingredients, variable expenses, and fixed costs. Payroll plans role-level FTE, salaries, hiring dates, bonuses, payroll tax controls, and monthly personnel expense.
CAPEX schedules startup assets and depreciation. CapTable and Debt support equity and financing inputs, while Sources & Uses shows how cash sources are allocated across operating, investing, and financing needs.
Income Statement, Cash Flow, Balance Sheet, Summary, Returns, Ratios, Valuation, Scenarios, Charts, Benchmarks, and model checks connect operating assumptions to decision-focused reporting.
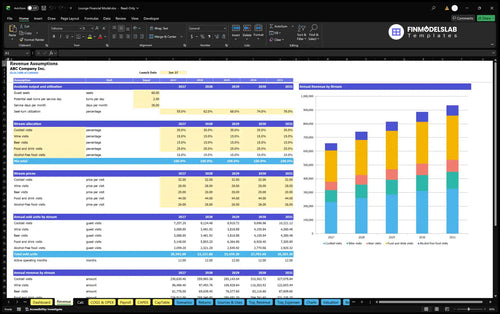
Revenue is capacity-driven: available seat visits are multiplied by utilization, allocated across one exclusive ticket mix, and priced by visit category.
Available monthly capacity is 60 seats × 2 turns × 26 service days, or 3,120 potential guest visits. The selected utilization rate then determines realized visits, which are allocated once across cocktail, wine, beer, food-and-drink, and alcohol-free food categories.
The ticket categories are mutually exclusive, so included food and drinks are not counted again as separate revenue streams. Selected net prices are $32, $28, $20, $44, and $26 per visit, with a 35% / 15% / 15% / 25% / 10% mix.
The Revenue Forecast shows the operating drivers that build lounge sales: available seat visits, utilization, ticket mix, prices, and annual revenue by category. It lets a buyer test how changes in capacity use or realized ticket value affect projected sales.
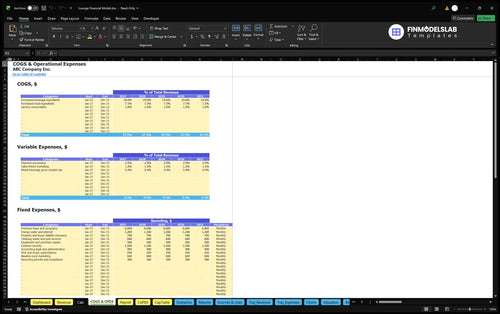
The model separates direct ingredients, sales-linked expenses, recurring fixed costs, and role-level Payroll so each payment component is counted once.
Direct costs are modeled as shares of total revenue: purchased beverage ingredients at 19%, purchased food ingredients at 7.5%, and service consumables at 1%. Variable operating expenses include payment processing at 2.9%, sales-linked marketing at 1.2%, and mixed beverage gross receipts tax at 5.36%.
Fixed operating expenses include occupancy, utilities, insurance, cleaning and pest services, repairs, contract security, professional administration, POS and music subscriptions, baseline local marketing, and recurring permits. The example lease input is $6,000 per month.
The COGS & Operating Expense Forecast separates direct costs, sales-linked expenses, and recurring fixed spending so gross margin, contribution margin, and EBITDA are not distorted by mixing cost types.
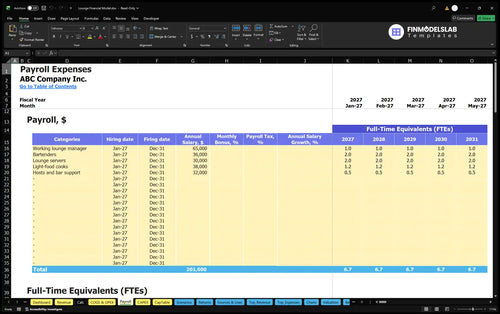
Payroll is kept outside COGS, Variable, and Fixed to avoid double counting. The planning case includes one working lounge manager, two bartenders, two lounge servers, 1.2 light-food cook FTE, and 0.5 host/bar-support FTE.
The Payroll Forecast shows role-level FTE and salary assumptions that feed monthly personnel expense. In this case, the selected fixed annual base payroll is $258,600 before any optional payroll-tax, bonus, or salary-growth controls are applied.
Startup assets, preopening cash items, working-capital inputs, and owner funding are modeled separately from recurring operating expenses.
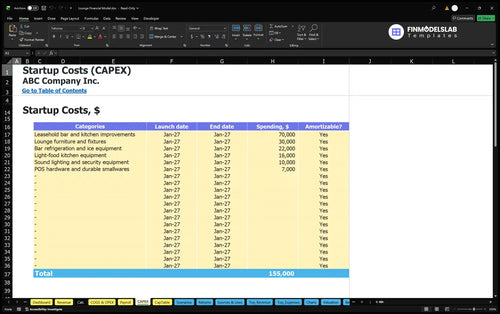
Startup assets are separate from annual operating expenses. The documented assets include $70,000 of leasehold bar and kitchen improvements, $30,000 of lounge furniture and fixtures, $22,000 of refrigeration and ice equipment, and $16,000 of light-food kitchen equipment, plus other sound, security, POS, and smallwares assets.
The Capital Expenditure Plan records startup asset budgets, timing, and depreciation treatment. It helps separate durable investment from operating costs and supports fixed-asset schedules used by the broader financial statements.
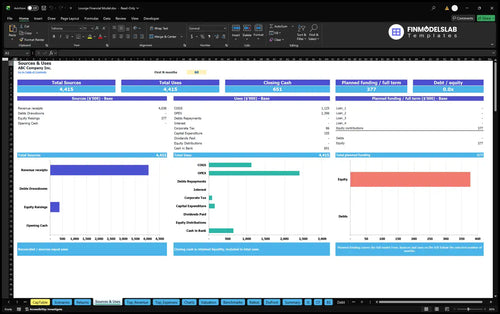
Opening cash items include the lease deposit, permits and professional setup, prelaunch marketing and training supplies, preopening occupancy and utilities, and preopening fixed-base training payroll. Initial owner funding is $377,312 in the illustrated case; no confirmed external financing is assumed.
The Sources and Uses of Funds report reconciles planned funding with cash allocation across startup, operating, investing, and financing uses. It helps distinguish equity contributions and debt from revenue and from operating earnings.
The supplied case shows rising utilization increasing revenue and EBITDA while fixed costs and fixed base payroll remain stable in the example.
| Year | Revenue | Operating Expenses | EBITDA |
|---|---|---|---|
| 2026 | $658,944 | $646,746 | $12,198 |
| 2027 | $742,810 | $677,742 | $65,067 |
| 2028 | $814,694 | $704,311 | $110,383 |
| 2029 | $886,579 | $730,880 | $155,700 |
| 2030 | $934,502 | $748,592 | $185,910 |
In the illustrated Base case, revenue grows as seat-turn utilization rises from 55% in 2026 to 78% in 2030 while the documented ticket mix and prices remain planning inputs. EBITDA increases from $12,198 to $185,910 as higher sales absorb the fixed cost base and fixed base payroll.
These results are operating forecasts through EBITDA, not observed industry results. They do not by themselves establish net profit, cash sufficiency, valuation, or investor return.
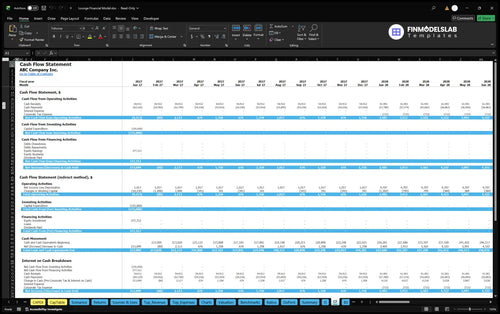
The Cash Flow Forecast shows operating, investing, and financing cash movements with opening-to-closing cash reconciliation. It is the report to inspect for liquidity and funding needs because EBITDA is not the same as cash flow.
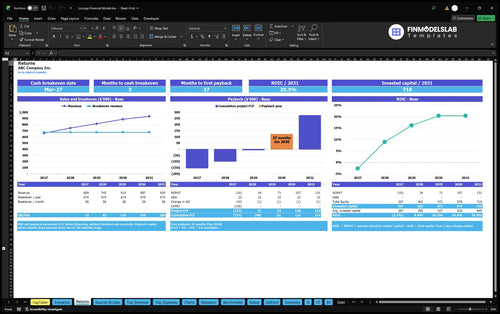
The workbook distinguishes operating break-even, cash break-even, investment payback, annual ROIC, and cash liquidity rather than treating them as interchangeable.
The Returns report keeps several decision measures separate. Sales break-even compares revenue with the operating cost structure; cash break-even focuses on cash coverage; investment payback tracks recovery of invested funds; and annual ROIC compares operating return with invested capital.
No payback month, ROIC percentage, or IRR is stated here because the supplied case does not provide those outputs. The model calculates them from the complete financial statement, investment, and cash-flow schedules.
The Return on Invested Capital Analysis brings together sales break-even, cash break-even, investment payback, and annual ROIC. It helps evaluate whether the operating plan can cover costs and how efficiently invested capital is used without treating EBITDA as investor cash return.
These answers summarize the model scope, editable drivers, reporting coverage, and interpretation limits.
Yes. The Revenue inputs let you edit seats, turns, service days, utilization, ticket mix, prices, and launch timing.
No. Each guest is assigned once to one mutually exclusive complete visit category before revenue is calculated.
Payroll is modeled separately by role and FTE, so salaries are not duplicated inside COGS, variable expenses, or fixed operating costs.
Yes. The workbook includes projected Income Statement, Cash Flow Statement, Balance Sheet, Summary, ratios, and related supporting schedules.
Yes. Dashboard Debt Controls support multiple facilities with amount, timing, term, interest-only period, rate, and repayment structure inputs.
No. They are illustrative planning projections built from the documented case assumptions, not observed lounge industry results or market benchmarks.
No. EBITDA is an operating earnings measure; use the Cash Flow and funding reports to evaluate liquidity and cash requirements.
KPIs, forecasts, and cash flow at a glance.
Key assumptions and calculations driving revenue forecasts.
Funding sources, spending, and closing cash.
Cash break-even, payback, and ROIC.
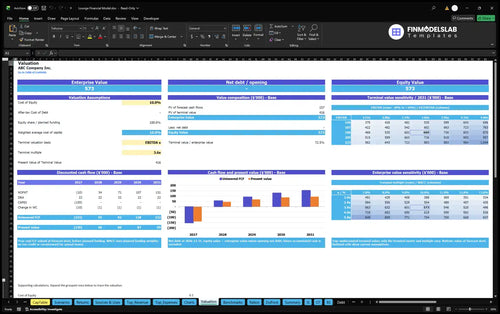
DCF valuation and sensitivity analysis.
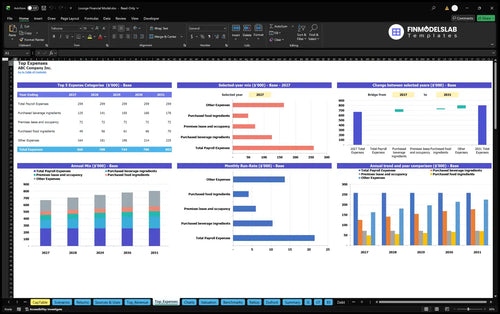
Largest costs and spending trends.
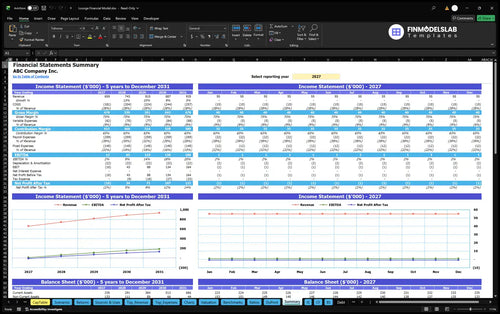
Annual and monthly financial performance.
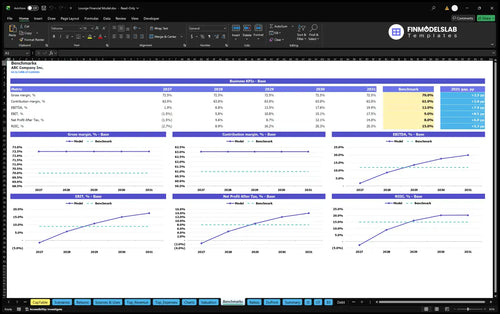
Compare margins and returns to benchmarks.

I’m not great with advanced Excel, and this template made the build feel manageable instead of technical. I cut my setup time by about six hours and could actually update the assumptions myself.

The profit and break-even tabs finally showed me where the money was going. I could spot weak margins fast and walk into a planning call with a clear break-even target.
I used to guess at runway and shortfalls, but this model gave me a clearer month-by-month view. It helped me flag a cash gap early and book a funding conversation before it became urgent.