Makeup Line Financial Projections Template in Excel

Five-year projections, dashboard, P&L, cash flow, balance sheet, and three scenarios - pre-built in Excel and Google Sheets. Built for a makeup line and delivered as an instant download.
Makeup Line Financial Model head image showing product overview and model purpose, summarizing key tabs and how the model helps project revenues, costs, cash runway and investor-ready reporting.
Fully Editable
Instant Download
Professional Design
Pre-Built
No Expertise Is Needed
Makeup Line Financial Model head image showing product overview and model purpose, summarizing key tabs and how the model helps project revenues, costs, cash runway and investor-ready reporting.
Industry Benchmarks
Projected balance sheet
Capital expenditure plan
Capitalization table
Cash flow forecast
Financial charts
COGS & Operating expense forecast
Financial model dashboard
DuPont analysis
Projected income statement
Payroll forecast
Financial ratio analysis
Return on invested capital analysis
Revenue forecast
Financial scenario analysis
Sources and uses of funds
Financial model summary
Top expense analysis
Top revenue streams
Business valuation analysis
Fully Editable
Instant Download
Professional Design
Pre-Built
No Expertise Is Needed
Makeup Line Bundle
See included products:
Financial Model iMakeup Line Bundle Financial Model template included in this product.
$149 $109
ADD TO YOUR ORDER
Business Plan iMakeup Line Bundle Business Plan template included in this product.
$79 $59
Pitch Deck iMakeup Line Bundle Pitch Deck template included in this product.
$49 $29
YOU SAVE $0 TODAY
30-Day Money-Back Guarantee
Created by a Former CFO
Updated for 2026
One-Time Purchase
Description

This Makeup Line Financial Model is an Excel template for a Dallas-based own-label color cosmetics brand using outsourced US stock-formula manufacturing, supplier-filled retail packs, third-party fulfillment, and national DTC and wholesale sales. It converts purchasing-account demand, units per account, seasonality, channel mix, realized prices, costs, staffing, startup inputs, and working capital into financial projections.

The illustrated case covers 2026 through 2030 and ends its operating forecast at EBITDA. Startup funding, CAPEX, working-capital assumptions, debt controls, cash flow, financial statements, break-even, payback, ROIC, scenarios, valuation, and other workbook reports remain separate analytical layers rather than being inferred from EBITDA.

Forecast
5years
Revenue streams
6product channels
Staff roles
3planned roles
MODEL CONTENTS

What Is Included in the Makeup Line Model

The workbook links industry-specific operating assumptions to monthly calculations, statements, funding schedules, scenario analysis, and management reports.

Revenue & Monthly Calc

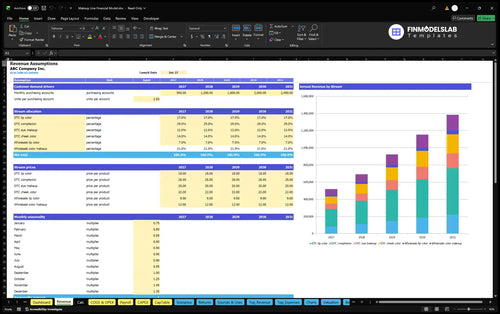
Revenue and Calc turn purchasing accounts, units per purchasing account, a repeating monthly demand profile, six exclusive product/channel shares, and net realized prices into monthly and annual sales without duplicating the unit pool.

Costs & Staffing

COGS & OPEX separates finished cosmetics, freight, fulfillment, marketing, processing, returns, stock losses, credit losses, and fixed overhead, while Payroll models the owner and operating staff by role, FTE, salary, and timing.

Funding & Assets

CAPEX records equipment and depreciation inputs, CapTable records owner equity, Dashboard Debt Controls feed financing schedules, and Sources & Uses explains how operating receipts, equity, debt, investment, and cash retention interact.

Statements & Analysis

IS, CF, BS, Summary, Scenarios, Returns, Valuation, Ratios, DuPont, Charts, Benchmarks, Top_Revenue, and Top_Expenses provide profitability, liquidity, financial position, scenario, return, valuation, and driver analysis using the model outputs.

REVENUE FORECAST

How the Model Calculates Makeup Revenue

Sales are demand-driven: monthly purchasing accounts are multiplied by units per account and seasonality, then allocated once across six exclusive product and channel streams.

The base case uses 900 monthly purchasing accounts in 2026, rising to 2,400 in 2030, with 2.5 units per purchasing account. A single January-through-December demand profile adjusts monthly finished units before product/channel allocation.

Four DTC streams and two wholesale streams then receive exclusive shares totaling 100%. Revenue equals allocated finished units multiplied by each stream’s net realized unit price, including $18 DTC lip color, $26 DTC complexion, and $12 wholesale color makeup.

Revenue Forecast

The Revenue Forecast shows the purchasing-account driver, units per account, monthly seasonality, six exclusive channel shares, and realized prices that build monthly and annual sales. This makes volume, mix, and pricing assumptions editable without counting the same finished units twice.

makeup line financial model revenue fml30
2026 annual demand logic

900 monthly purchasing accounts × 2.5 units per account × monthly seasonality × 100% allocated mix = finished units sold by stream.

COSTS AND PAYROLL

How Operating Costs and Staffing Affect EBITDA

The model separates direct COGS, revenue-linked operating costs, monthly fixed expenses, and fixed-salary payroll so each payment component is counted once.

COGS & Operating Expense Forecast

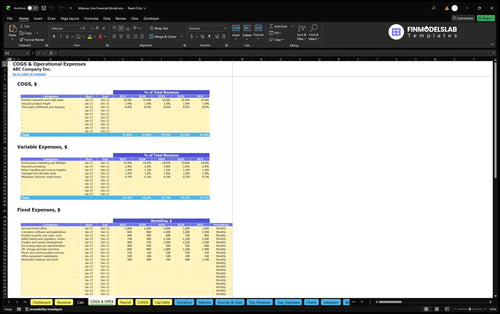
The COGS & Operating Expense Forecast separates finished cosmetics and retail packs, inbound freight, fulfillment and shipping, variable selling costs, and monthly fixed overhead. These assumptions feed gross margin, contribution margin, and EBITDA without mixing payroll into COGS or fixed operating expense categories.

makeup line financial model cogs opex fml30

COGS assumptions are 32% for finished cosmetics and retail packs, 1% for inbound freight, and 8% for third-party fulfillment and shipping. Variable operating costs include 14% performance marketing and affiliates, 2.8% payment processing, 1.2% return handling, 1% damaged or obsolete stock, and 0.3% wholesale credit losses.

Fixed coverage includes the serviced office, commerce software, insurance, safety and regulatory review, creative development, professional administration, 3PL base storage and receiving, communications, office equipment maintenance, and wholesale travel. The serviced brand office example is $1,000 per month for 12 paid months.

Payroll Forecast

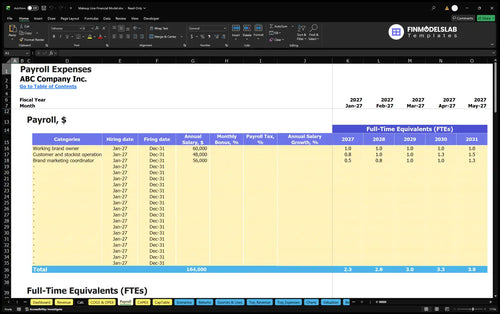
The Payroll Forecast shows planned FTE and fixed base salary by role, including the working brand owner, customer and stockist operations, and the brand marketing coordinator. It lets staffing scale separately from revenue-linked expenses while keeping payroll out of COGS and other expense buckets.

makeup line financial model payroll fml30
No double counting

The listed salaries are modeled through Payroll and are excluded from COGS, Variable, and Fixed operating expense inputs.

STARTUP AND FUNDING

How Startup Assets and Opening Funding Are Modeled

Startup equipment, prelaunch cash items, working-capital days, and owner funding are tracked separately from recurring operating expenses and EBITDA.

Capital Expenditure Plan

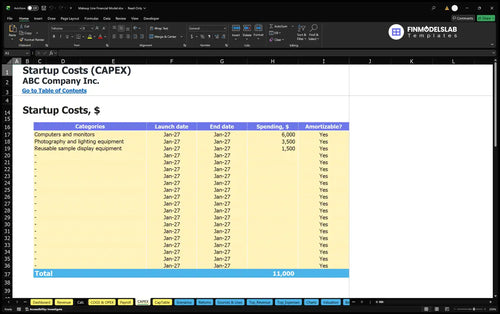
The Capital Expenditure Plan records startup equipment such as computers and monitors, photography and lighting equipment, and reusable sample display equipment. Depreciable asset schedules remain distinct from recurring operating expenses and from separate preopening cash items.

makeup line financial model capex fml30

The case includes $6,000 for computers and monitors, $3,500 for photography and lighting equipment, and $1,500 for reusable sample display equipment. Separate opening cash items cover the office deposit, label and brand setup, prelaunch screening, launch campaign, legal review, preopening payroll, office services, and setup fees.

Working-capital controls use 5 accounts-receivable days, 0 accounts-payable days, and 72 inventory days. Initial owner funding is $219,615 and is designed around startup assets, distinct prelaunch cash, opening net working capital, and three months of recurring cash outflows; it is not operating revenue.

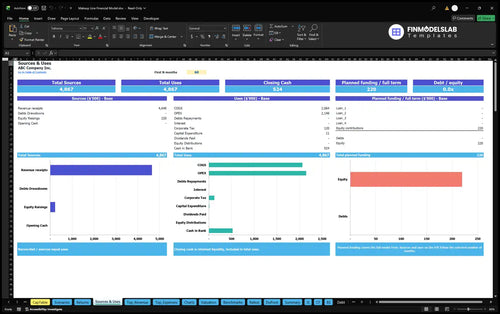
Sources and Uses of Funds

The Sources and Uses of Funds report reconciles operating receipts, equity, debt, operating payments, investment, financing payments, and cash retained in the business. It helps distinguish opening owner funding and asset purchases from the EBITDA generated by ongoing makeup sales.

makeup line financial model sources uses fml30
ILLUSTRATIVE FORECAST

What the Five-Year Operating Forecast Shows

The documented base case grows revenue from $519,210 in 2026 to $1,384,560 in 2030 while EBITDA rises from $24,526 to $231,870.

Illustrative annual forecast, USD
Year Revenue Operating Expenses EBITDA
2026 $519,210 $494,684 $24,526
2027 $692,280 $638,845 $53,435
2028 $923,040 $806,393 $116,647
2029 $1,153,800 $971,341 $182,459
2030 $1,384,560 $1,152,690 $231,870

Illustrative model outputs rounded to whole dollars; source calculations retain original precision.

The forecast reflects higher purchasing accounts, the same 2.5 units per account, the repeating monthly demand profile, product/channel mix, realized prices, and the defined cost structure. EBITDA is an operating result and should not be treated as net profit or as proof of cash sufficiency.

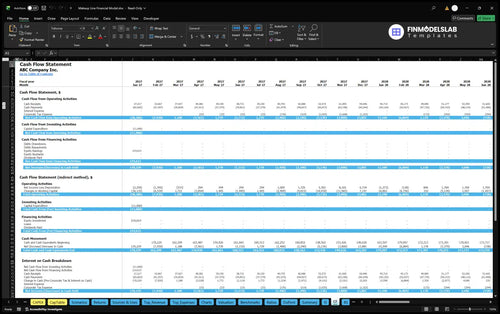
Cash Flow Forecast

The Cash Flow Forecast tracks operating, investing, and financing cash movements and reconciles opening to closing cash. It is the appropriate report for testing liquidity and funding needs because EBITDA does not include working-capital movements, capital spending, debt flows, or equity funding.

makeup line financial model cf fml30
BREAK-EVEN AND RETURNS

What Break-Even, Payback, and ROIC Can Evaluate

The Returns report separates operating break-even, cash break-even timing, investment payback, and annual ROIC rather than treating them as one return measure.

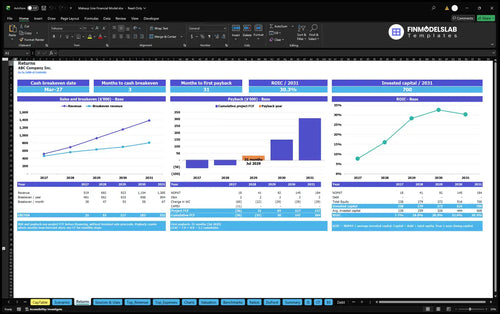
Return on Invested Capital Analysis

The Return on Invested Capital Analysis combines sales break-even, cash break-even timing, project and cumulative free cash flow, investment payback, invested capital, and annual ROIC. It supports return analysis without assuming a payback month or ROIC value that is not documented in the supplied case.

makeup line financial model returns fml30

Sales break-even asks how much revenue is needed to cover the modeled cost structure. Cash break-even considers actual cash generation and timing, while payback measures when cumulative project cash flow recovers invested funds and ROIC compares operating returns with invested capital.

Dashboard Scenario Controls can apply Low, Base, and High multipliers to revenue, COGS, variable expenses, fixed expenses, and payroll. Valuation can then use discounted unlevered free cash flow and terminal assumptions, but no valuation result is claimed here because the supplied case does not provide one.

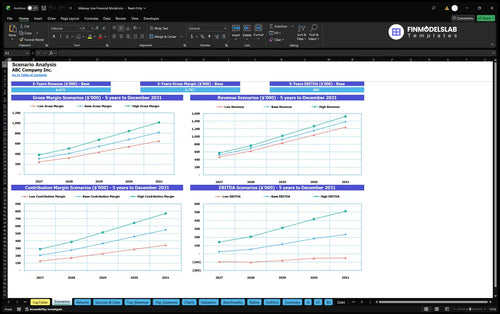
Financial Scenario Analysis

The Financial Scenario Analysis compares Low, Base, and High cases for revenue, gross margin, contribution margin, and EBITDA. It helps test how changes in sales and cost assumptions affect operating profitability before a user relies on the base-case forecast.

makeup line financial model scenarios fml30
MODEL FIT

Where This Makeup Line Model Fits

The structure fits an outsourced US color-cosmetics brand with DTC and wholesale demand, third-party fulfillment, a small office team, and no owned manufacturing or retail store.

How much product demand is needed?

Edit purchasing accounts, units per account, seasonality, mix, and realized prices; review monthly and annual revenue, margins, EBITDA, cash flow, and break-even outputs.

How should staffing scale?

Change FTE and salaries by role; review payroll expense and operating profitability without embedding staff pay inside COGS or other operating cost assumptions.

How much opening funding is required?

Adjust startup assets, preopening cash, working-capital days, equity, or debt; then review Sources & Uses, financing schedules, cash flow, balance sheet, and liquidity checks.

What is outside this case?

The supplied operating case excludes an owned factory, retail store, skincare, drug claims, importing, and marketplace sales. Those activities would require different operating drivers and cost assumptions.

FAQ

Frequently Asked Questions

These answers summarize the model scope, editable assumptions, forecast logic, and supported analysis.

What drives revenue in this makeup line financial model?

Monthly purchasing accounts, units per account, seasonality, six exclusive product/channel shares, and each stream’s net realized unit price drive the revenue forecast.

Can I change the DTC and wholesale sales mix?

Yes. The six channel shares are editable and allocate one finished-unit pool across four DTC and two wholesale streams, so the total mix should remain 100%.

Does the model include manufacturing payroll?

No. The case assumes outsourced US stock-formula manufacturing; payroll covers the working owner, customer and stockist operations, and a brand marketing coordinator.

How are fulfillment and marketing costs modeled?

Third-party fulfillment and shipping are modeled in COGS, while performance marketing, processing, returns, stock losses, and wholesale credit losses are separate revenue-linked operating costs.

Does EBITDA equal cash flow or net profit?

No. EBITDA is an operating earnings measure; cash flow also reflects working capital, CAPEX, debt, equity, and financing movements, while net profit includes additional accounting items.

What startup funding is included in the example case?

The case uses $219,615 of initial owner funding for startup assets, separate prelaunch cash, opening working capital, and three months of recurring cash outflows.

Can the workbook test different scenarios?

Yes. Dashboard Scenario Controls apply Low, Base, and High multipliers to revenue, COGS, variable expenses, fixed expenses, and payroll for side-by-side profitability analysis.

Does the template calculate break-even and investment returns?

Yes. Returns covers sales break-even, cash break-even timing, investment payback, and annual ROIC, while Valuation provides DCF and sensitivity analysis using workbook assumptions.

What Does the Makeup Line Financial Model Contain?

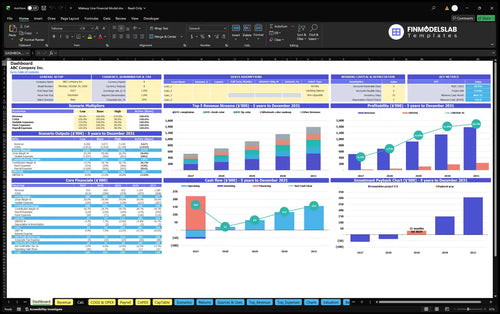
makeup line financial model dashboard fml30

Financial Dashboard

KPIs, forecasts, and cash flow at a glance.

makeup line financial model revenue fml30

Revenue Engine

Key assumptions and calculations driving revenue forecasts.

makeup line financial model sources uses fml30

Sources & Uses

Funding sources, spending, and closing cash.

makeup line financial model returns fml30

Returns & Break-Even

Cash break-even, payback, and ROIC.

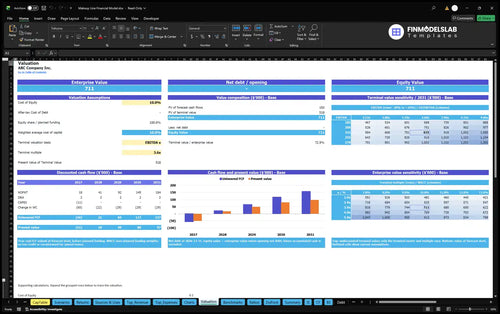
makeup line financial model valuation fml30

Business Valuation

DCF valuation and sensitivity analysis.

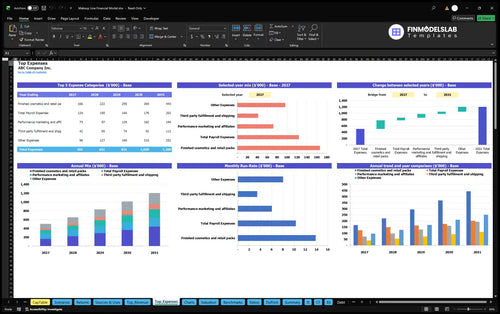
makeup line financial model top expenses fml30

Expense Breakdown

Largest costs and spending trends.

makeup line financial model summary fml30

Financial Summary

Annual and monthly financial performance.

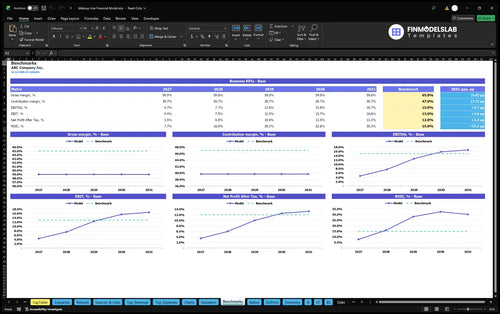
makeup line financial model benchmarks fml30

KPI Benchmarks

Compare margins and returns to benchmarks.

Trusted by 25,000+ startup founders, investors and CPAs

Saved Me So Much Time

Megan Carter, CA

5 star rating

Building the model by hand would have eaten up my week, but this template cut the setup down to a few hours. I could move straight into planning instead of wrestling with formulas.

Clear Scenarios Fast

David Thompson, NY

4 star rating

Switching between low, base, and high cases used to take forever, and I’d still worry I missed something. Here I changed the assumptions in one place and had all three cases ready for a meeting the same day.

All Reports In One Place

Lauren Mitchell, TX

4 star rating

I used to keep statements and charts in separate files, which made updates messy and slow. This template brought everything together, and I had a cleaner set of reports to share with my team.