

Set Product Lines
Define enabled manufactured products and each applicable launch date.


This editable Excel workbook models greenhouse manufacturing using product units and prices across a five-year monthly and annual forecast with integrated financial statements.
Use the workbook to test how product volumes, unit pricing, manufacturing costs, staffing, capital needs, financing, and timing affect projected results.
Editable operating assumptions feed the monthly calculation engine, which rolls into five-year statements, scenario comparisons, and management views.
Each enabled product line multiplies units produced by the matching sales price, allocates annual revenue through monthly seasonality once, then adds enabled ancillary revenue.
Define enabled manufactured products and each applicable launch date.
Enter physical units produced for each enabled product line and forecast period.
Multiply each product line's units produced by its matching sales price.
Allocate annual product-line revenue through the monthly seasonality schedule once.
Sum all enabled product-line revenue and any separately entered ancillary revenue.
The Revenue sheet ties product-line units, sales prices, launch timing, and monthly seasonality to the manufacturing revenue forecast.
 REVENUE
The COGS sheet organizes direct manufacturing costs by product, using percentage-of-revenue and per-unit calculation bases across annual and monthly periods.
 COGS
The Scenarios view compares Low, Base, and High revenue, gross margin, contribution margin, and EBITDA paths across the five-year forecast.
 SCENARIOS
The Dashboard combines setup controls, scenario outputs, revenue mix, profitability, cash flow, payback, working capital, and selected key metrics.
 DASHBOARD
The ready-made model fits product-line manufacturing logic, while structurally different revenue mechanics, schedules, or reporting may require custom modeling.
The template is a planning starting point, not a guarantee of performance.
Financial Models Lab can build or adapt a model when your requirements call for different revenue logic, operating schedules, or financial reporting.
ORDER A CUSTOM FINANCIAL MODELAfter checkout, you receive the editable Excel financial model for immediate download, with five-year monthly and annual forecasting and scenario analysis.
Open the fully editable Excel model and replace assumptions with your own planning inputs.
Review five-year projections with monthly and annual financial detail.
Compare Low, Base, and High cases through the included scenario view.
Review integrated income statement, cash flow, balance sheet, and summary outputs.
The essential answers are visible in full, with no accordion clicks required.
Revenue is calculated from each enabled product line using units produced and the matching sales price, with monthly seasonality applied once and enabled ancillary revenue added.
You can edit product-line names, applicable launch dates, unit volumes, sales prices, monthly seasonality, the sell-through or inventory convention when shown, and enabled ancillary revenue.
The Scenarios view compares Low, Base, and High paths for revenue, gross margin, contribution margin, and EBITDA across the five-year forecast.
The workbook includes an income statement, cash flow statement, balance sheet, Dashboard, Scenarios, Summary, and additional financial analysis reports.
Yes. Financial Models Lab can build or adapt a financial model when you need different revenue logic, operating schedules, or reporting.
It is a planning forecast based on editable assumptions, not a guarantee of business performance or financial results.
You receive a comprehensive and downloadable Excel template for greenhouse construction startup costs, complete with a dynamic dashboard, detailed financial statements, and fully customizable assumptions for your specific business plan.

Core inputs and core outputs
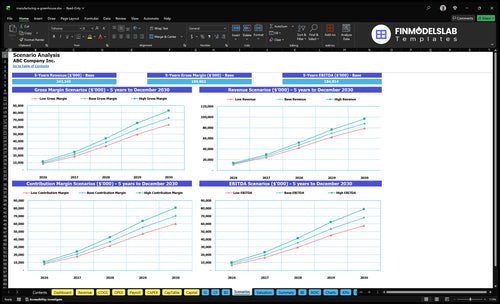
Three scenario analysis

Presentation ready
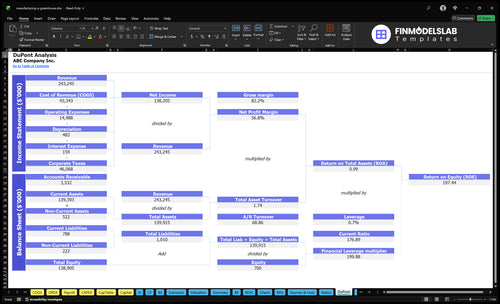
DuPont analysis
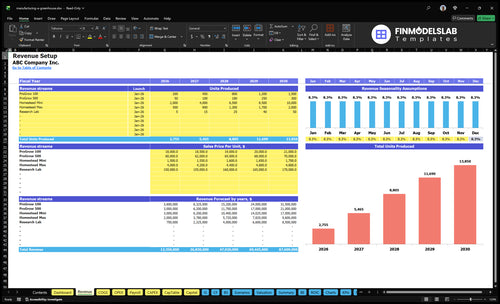
Researched revenue assumptions

Lender-friendly financial outputs
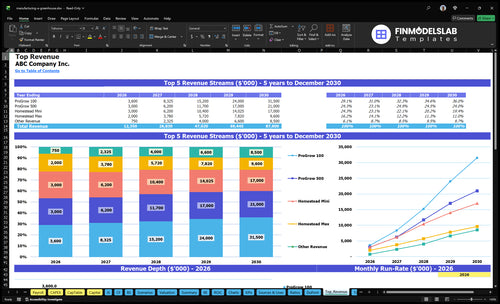
Revenue stream detailed view

Performance metrics benchmark

This template let me compare low, base, and high cases without rebuilding the sheet each time. I saved about 6 hours and could explain the scenarios clearly in one meeting.

I used to spend days building projections by hand, but this file cut that down to an afternoon. It saved me nearly 10 hours and gave me a clean model to share right away.
The pricing, cost, and growth inputs finally felt organized instead of scattered across tabs. I cleaned up the assumptions in under an hour and had a much easier time reviewing the numbers.