

Acquire Buyers
Store visitors × visitor-to-buyer conversion determines new buyers each month.


This editable five-year spreadsheet model turns visitor conversion, repeat-customer behavior, product mix, pricing, costs, and scenarios into linked financial statements and management outputs.
Use the workbook to test how store traffic, conversion, repeat purchasing, basket size, product mix, pricing, and operating costs shape a five-year plan.
Editable assumptions feed monthly calculations, which roll into annual summaries, Low/Base/High comparisons, and linked Income Statement, Cash Flow, and Balance Sheet outputs.
The model converts store visitors into buyers, carries repeat-customer cohorts forward, builds orders and units, allocates units by category, then applies category prices.
Store visitors × visitor-to-buyer conversion determines new buyers each month.
A set share of new buyers becomes repeat customers active for the stated lifetime.
Monthly orders combine first orders with active repeat customers × repeat order frequency.
Orders × units per order creates volume, then sales mix allocates units by category.
Allocated category units × category price produces revenue, summed across categories and months.
The Revenue sheet organizes visitor traffic, buyer conversion, repeat-customer cohorts, order frequency, unit volume, sales mix, and category pricing in one operating schedule.
 REVENUE
The COGS & OPEX sheet separates direct merchandise costs, variable expenses, and fixed operating costs with timing and periodicity controls for forecasting.
 COGS & OPEX
The Scenarios view compares Low, Base, and High paths for revenue, gross margin, contribution margin, and EBITDA across the five-year forecast.
 SCENARIOS
The Dashboard brings setup controls, selected-case outputs, headline KPIs, revenue mix, profitability, cash flow, and investment payback into one management view.
 DASHBOARD
The ready-made model fits businesses using this visitor-conversion, repeat-customer, basket, category-mix logic; materially different operating structures may need custom modeling.
The template is a planning starting point, not a guarantee of performance.
Financial Models Lab can build or adapt a model when your requirements call for different revenue logic, operating schedules, calculations, or reporting.
ORDER A CUSTOM FINANCIAL MODELAfter checkout, you receive the editable five-year financial model files for download, with scenarios, linked statements, and management reports ready for your inputs.
Work in the fully editable model using the supplied Excel and Google Sheets files.
Plan across 60 months with monthly calculations and annual views.
Compare Low, Base, and High cases as assumptions change.
Review the Income Statement, Cash Flow, Balance Sheet, Dashboard, and summary outputs.
The essential answers are visible in full, with no accordion clicks required.
The model converts store visitors into new buyers, carries repeat cohorts forward, converts orders into units, allocates units by category, and applies category prices.
You can change launch date, weekday visitors, conversion, repeat-customer share and lifetime, repeat order frequency, units per order, sales mix, category prices, and monthly seasonality.
The Scenarios view compares Low, Base, and High paths for revenue, gross margin, contribution margin, and EBITDA across five years.
The product gallery shows the Income Statement, Cash Flow, Balance Sheet, Dashboard, Summary, ratios, valuation, and additional management report views.
Yes. Financial Models Lab offers custom financial modeling when you need different revenue logic, operating schedules, calculations, or reporting.
It is a forecast model, not a guarantee of performance. Results change with the assumptions entered.
You receive a comprehensive and downloadable financial model for a maternity wear startup, complete with pre-built financial statements, dashboards, and detailed assumption tabs.
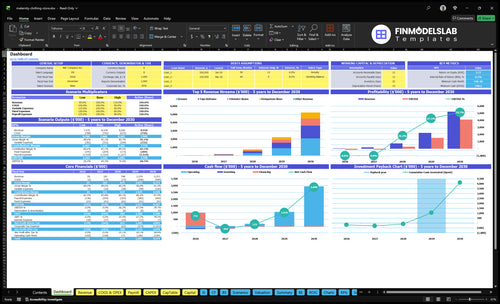
Core inputs and core outputs

Three scenario analysis

Presentation ready
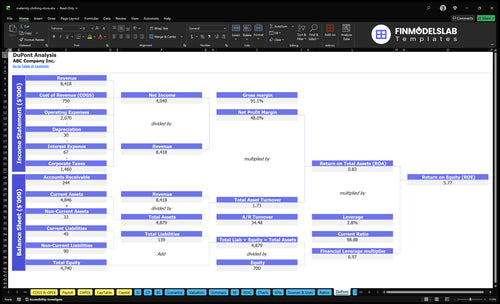
DuPont analysis

Researched revenue assumptions
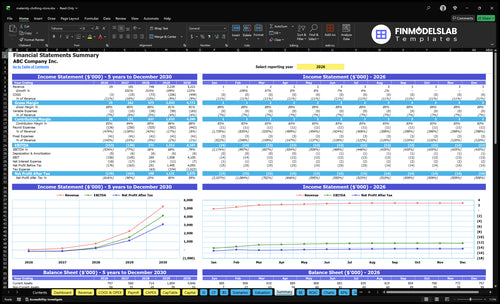
Lender-friendly financial outputs
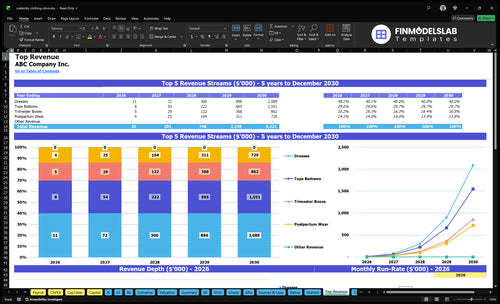
Revenue stream detailed view

Performance metrics benchmark

This template pulled my statements and charts into one place, so I stopped digging through different files. It saved me a few hours each month and made it much easier to share updates with our team.

I used to rebuild low, base, and high cases by hand, and it ate up time. With this model, I tested three outcomes in one afternoon and had a clearer planning conversation the same day.
The model made our margins and break-even point easy to see without extra spreadsheet work. That clarity helped us spot one weak product line and prepare a cleaner forecast for our lender meeting.