

Operations & revenue
Revenue and Calc convert launch timing, available clinician hours, utilization, service mix, and realized hourly prices into monthly treatment revenue by stream.


This Medical Spa Financial Model is an Excel template for a physician-owned, three-treatment-room clinical spa in Raleigh, North Carolina. It projects 2026 through 2030 from clinician-hour capacity, utilization, treatment mix, realized hourly pricing, operating costs, staffing, startup investment, and working-capital assumptions.
The workbook connects medical-spa operating assumptions to monthly calculations, financial statements, funding schedules, scenario analysis, and management reports.
Revenue and Calc convert launch timing, available clinician hours, utilization, service mix, and realized hourly prices into monthly treatment revenue by stream.
COGS & OPEX and Payroll separate direct product and consumable costs, variable expenses, fixed overhead, role-level FTE, salaries, bonuses, and payroll calculations.
CAPEX, CapTable, Debt, and Sources & Uses organize startup assets, owner contributions, financing facilities, cash allocation, repayment schedules, and funding mix.
IS, CF, BS, Summary, Scenarios, Valuation, Returns, Ratios, DuPont, Charts, Top_Revenue, Top_Expenses, Benchmarks, and Checks provide connected reporting and review functions.
Revenue is capacity-driven: monthly clinician hours are multiplied by utilization, allocated by treatment mix, and valued at each service’s realized hourly price.
In 2026, 264 available clinician hours multiplied by 40% utilization produces 105.6 sold clinician hours per month. Those hours are allocated across five treatment categories, so the same capacity pool is not duplicated across services.
The Revenue Forecast shows the operating drivers behind treatment sales, including capacity, utilization, service mix, annual realized prices, and revenue by stream. It helps connect appointment-production assumptions directly to projected revenue rather than using a top-down sales growth percentage.
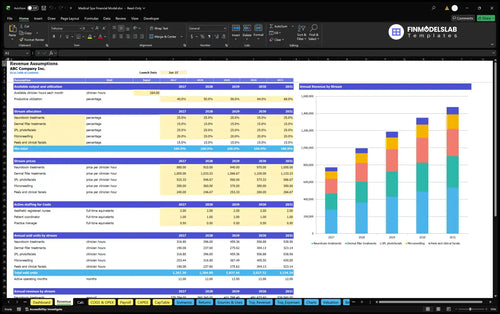
264 available clinician hours × 40% utilization = 105.6 sold clinician hours per month.
The model separates revenue-linked direct costs, variable expenses, fixed overhead, and salaried payroll so each payment component is counted once.
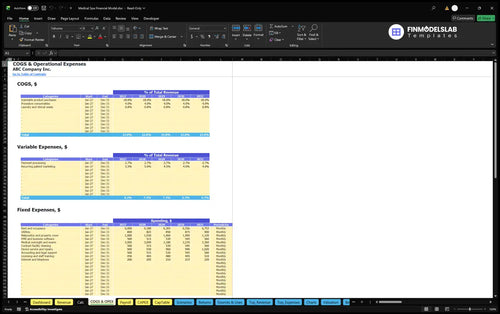
Direct costs use revenue percentages for injectable product purchases at 18%, procedure consumables at 4%, and laundry and clinical waste at 0.8%. Variable expenses include 2.7% payment processing and recurring patient marketing that declines from 5.5% in 2026 to 4% by 2029 and 2030.
Fixed coverage includes rent, utilities, insurance, EMR and business software, physician oversight and exams, cleaning, device service, professional support, licensing and training, internet, and telephone. Salaries are kept in Payroll rather than duplicated in operating-cost percentages.
The COGS & Operating Expense Forecast separates direct costs, variable operating expenses, and fixed expenses by category and timing. For this case, it makes the revenue-linked injectable and consumable burden visible alongside marketing, processing fees, rent, software, oversight, and other overhead.
| Category | 2026 | 2030 |
|---|---|---|
| COGS | $176,050 | $336,285 |
| Variable expenses | $63,316 | $98,821 |
| Fixed expenses | $166,200 | $186,756 |
| Payroll | $292,500 | $292,500 |
Illustrative case amounts are rounded to whole dollars; payroll is separate from COGS, variable, and fixed operating expenses.
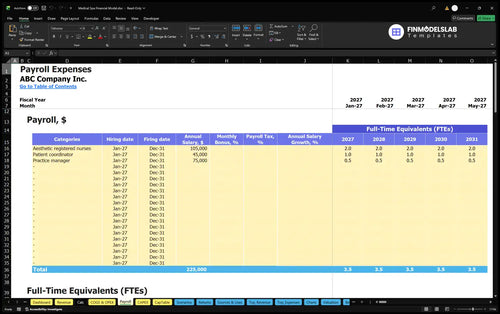
The Payroll Forecast shows role-level staffing and compensation inputs that feed monthly personnel expense. The illustrated plan uses 2 aesthetic registered nurse FTE at $105,000 each, 1 patient coordinator at $45,000, and 0.5 practice manager FTE at a $75,000 annual base per FTE.
Startup assets, preopening cash, working capital, and owner funding are modeled separately from annual operating expenses and EBITDA.
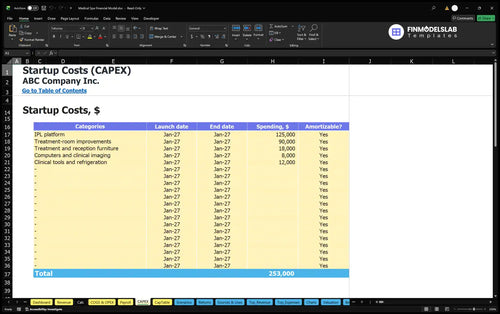
The opening investment includes a $125,000 IPL platform, $90,000 of treatment-room improvements, $18,000 of treatment and reception furniture, and $8,000 of computers and clinical imaging, plus clinical tools and refrigeration. Separate preopening cash items cover deposits, setup, licenses, launch marketing, occupancy, training, and software onboarding.
The Capital Expenditure Plan records startup asset purchases, expenditure dates, depreciable status, and the resulting depreciation and net book value schedules. It separates equipment and build-out investment from recurring medical-spa operating expenses.
The workbook can also model equity contributions and up to four financing facilities through the Dashboard and Debt schedules. Those controls are optional financing mechanics; the source case does not provide a specific borrowing amount, interest rate, repayment schedule, or lender assumption.
The Sources and Uses of Funds report reconciles revenue receipts, debt, equity, operating payments, investment, financing payments, and retained cash over a selectable period. It helps distinguish how the medical spa is funded from how much operating EBITDA it generates.
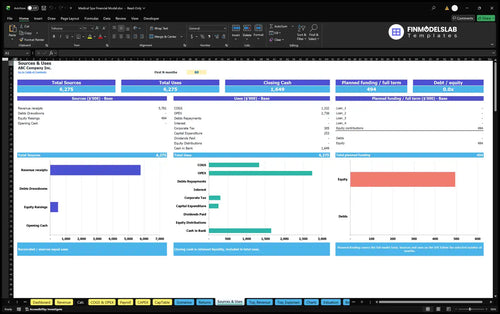
The documented base case grows revenue as utilization and realized treatment prices rise while operating expenses increase more slowly, expanding EBITDA over the forecast.
| Year | Revenue | Operating Expenses | EBITDA |
|---|---|---|---|
| 2026 | $772,147 | $698,066 | $74,082 |
| 2027 | $995,016 | $767,220 | $227,796 |
| 2028 | $1,188,824 | $825,487 | $363,337 |
| 2029 | $1,349,990 | $872,259 | $477,731 |
| 2030 | $1,474,936 | $914,362 | $560,574 |
Illustrative projections are rounded to whole dollars; display rounding may create small differences from source precision.
Revenue increases from $772,147 in 2026 to $1,474,936 in 2030 as productive utilization rises from 40% to 68% and annual realized prices increase by treatment. EBITDA rises from $74,082 to $560,574 in the illustrated case as the fixed staffing base and overhead are spread across more sold clinician hours.
These are model outputs, not observed industry results or guaranteed performance. The operating case is documented through EBITDA, so net profit, taxes, debt service, valuation, and cash sufficiency should be read from their specific workbook reports rather than inferred from EBITDA.
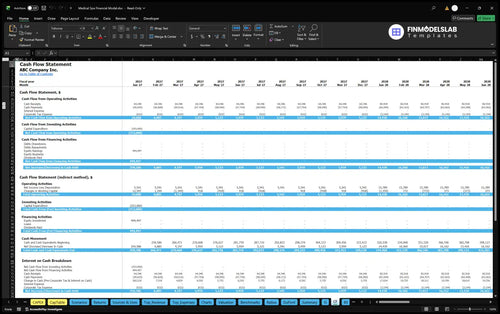
The Cash Flow Forecast shows monthly operating, investing, and financing cash movements with an opening-to-closing cash reconciliation. It is the report to inspect for liquidity, funding requirements, capital spending, debt service, and cash generation rather than treating EBITDA as cash.
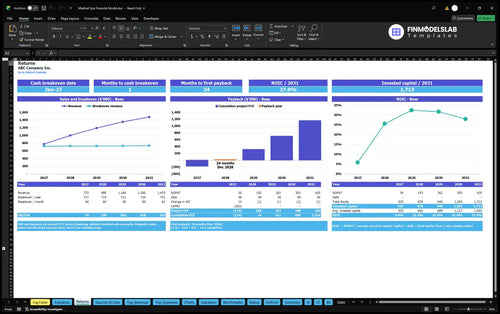
Returns and scenario reports help compare operating break-even, cash recovery, invested-capital returns, and sensitivity without inventing a return result from the EBITDA forecast.
The Returns report distinguishes sales break-even from cash break-even, investment payback, and annual return on invested capital. These measures answer different questions: whether sales cover operating costs, when cumulative project cash flow recovers investment, and how effectively invested capital generates returns.
The Return on Invested Capital Analysis combines sales break-even, cash break-even timing, project and cumulative free cash flow, investment payback, invested capital, and annual ROIC. The source case does not provide a tested payback month or ROIC percentage, so those results should be read from the completed workbook.
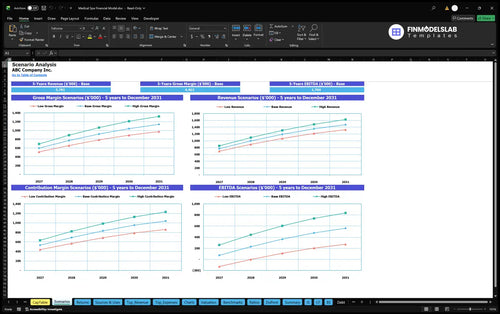
Scenario Controls on the Dashboard apply Low, Base, and High multipliers to revenue, COGS, variable operating expenses, fixed operating expenses, and payroll. This provides a structured way to test downside and upside operating cases without overwriting the underlying medical-spa assumptions.
The Financial Scenario Analysis compares Low, Base, and High cases for revenue, gross margin, contribution margin, and EBITDA. It helps evaluate how changes in medical-spa sales and cost assumptions alter operating profitability across the forecast period.
These answers clarify the operating logic, editable assumptions, reporting scope, and limitations of the template.
It multiplies available clinician hours by utilization, allocates sold hours by treatment mix, and applies each service’s annual realized hourly price.
Yes. The Revenue inputs are designed for editable utilization, service mix, realized prices, launch timing, and other operating assumptions that feed monthly calculations.
Payroll is modeled separately by role and FTE, preventing the listed salaries from being counted again in COGS, variable expenses, or fixed overhead.
Yes. CAPEX can schedule items such as the IPL platform, treatment-room improvements, furniture, computers, clinical imaging, and other startup assets.
No. EBITDA is an operating measure; cash flow and net profit also reflect items such as working capital, CAPEX, financing, depreciation, interest, and taxes.
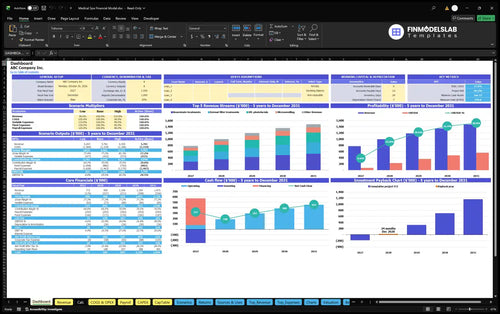
KPIs, forecasts, and cash flow at a glance.
Key assumptions and calculations driving revenue forecasts.
Funding sources, spending, and closing cash.
Cash break-even, payback, and ROIC.
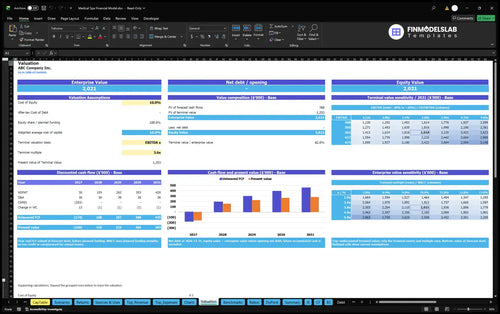
DCF valuation and sensitivity analysis.
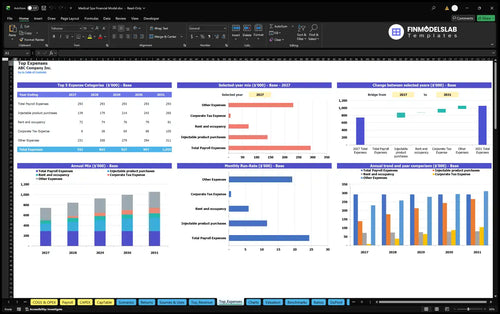
Largest costs and spending trends.
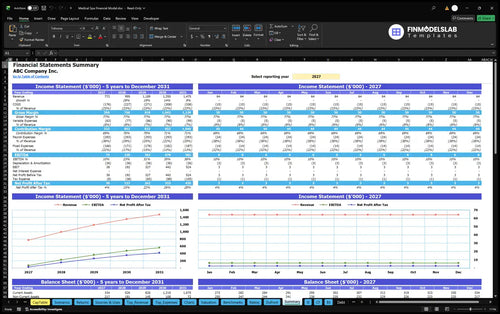
Annual and monthly financial performance.
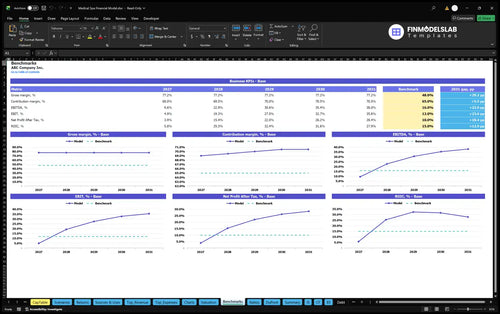
Compare margins and returns to benchmarks.

I could finally compare low, base, and high cases without rebuilding the sheet every time. It saved me hours and made it much easier to present assumptions in one meeting.

The cash-flow tab made it clear when we’d run short and how long we had left. I booked a planning call with my partner the same day because the runway picture was finally easy to read.
I stopped worrying about one broken formula throwing off the whole model. The structure helped me catch issues fast and cut my review time by about half.