

Revenue & Calc
Revenue inputs define launch timing, guest visits, items per guest, seasonality, category mix, and menu prices. Calc converts them into monthly item volumes and sales.


This Mexican Restaurant Financial Model is an Excel planning template for an independent 80-seat restaurant serving lunch, dinner, direct pickup, and a small bar. It links guest demand, menu mix, prices, staffing, operating costs, startup spending, working capital, and funding to monthly and annual projections.
The illustrated case is demand-driven. One shared pool of paid guest visits becomes menu items that are allocated once across six food and drink categories; sales tax and customer gratuities are excluded from revenue.
The workbook connects operating assumptions to detailed calculations, financial statements, scenario analysis, funding schedules, and management reports.
Revenue inputs define launch timing, guest visits, items per guest, seasonality, category mix, and menu prices. Calc converts them into monthly item volumes and sales.
COGS & OPEX separates direct, variable, and fixed costs. Payroll plans annual-average FTE and fixed base salaries by restaurant role.
CAPEX schedules opening assets. CapTable, debt controls, Debt, and Sources & Uses support equity, financing, and cash-allocation planning.
IS, CF, BS, Summary, Scenarios, Returns, Valuation, Ratios, Charts, Top_Revenue, Top_Expenses, and Checks provide linked financial analysis and reconciliations.
Revenue starts with paid guest visits, multiplies them by 2.3 items per guest, applies seasonality, and allocates the item pool across six menu categories at annual net prices.
Paid guest visits rise from 2,600 per month in 2026 to 3,400 in 2030 before seasonality. The monthly pattern ranges from 0.90 in January and February to 1.10 in May and June.
Five editable category shares plus residual nonalcoholic drinks total 100%. Category revenue equals allocated items multiplied by annual net price, so the shared demand pool is counted once.
The Revenue Forecast shows guest visits, items per guest, menu mix, seasonality, annual prices, and revenue by stream. These inputs feed monthly Calc and annual sales.
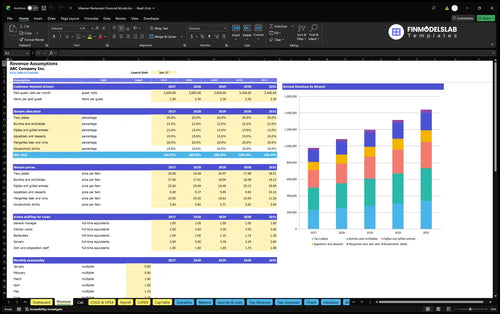
2,600 paid guest visits × 2.3 items per guest = 5,980 menu items before monthly seasonality.
The model separates restaurant COGS, sales-linked variable expenses, fixed overhead, and Payroll so each payment component is counted once.
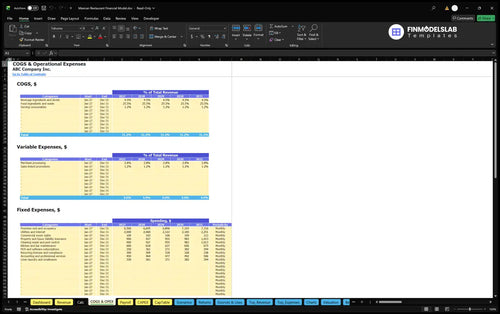
COGS uses 25.5% for food ingredients and waste, 4.5% for beverage ingredients and shrink, and 1.2% for serving consumables. Variable expenses add 2.8% merchant processing and 1.2% sales-linked promotions.
Fixed costs include rent, utilities, insurance, cleaning, maintenance, software, licenses, professional services, linen, and smallwares. Rent starts at $6,500 per month in 2026.
The COGS & Operating Expense Forecast organizes direct, variable, and fixed restaurant costs by category and timing. It shows how operating assumptions affect contribution and EBITDA.
| Category | 2026 | 2030 |
|---|---|---|
| COGS | $305,164 | $449,178 |
| Variable | $39,124 | $57,587 |
| Fixed | $149,400 | $168,151 |
| Payroll | $337,000 | $390,400 |
Illustrative forecast amounts rounded to whole dollars.
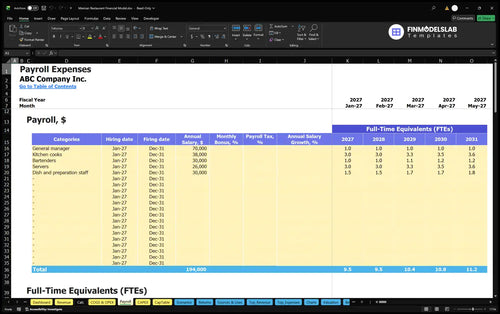
The Payroll Forecast shows FTE and salary assumptions for the general manager, cooks, bartenders, servers, and dish/preparation staff. Payroll remains separate from COGS and operating expenses.
Opening investment is modeled separately from annual operating expenses, distinguishing CAPEX, preopening cash, working capital, and owner funding from EBITDA.
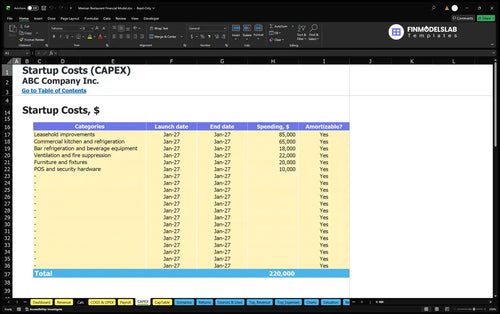
The case includes $85,000 of leasehold improvements, $65,000 of kitchen and refrigeration equipment, $18,000 of bar equipment, and $22,000 of ventilation and fire suppression, plus other opening assets.
Preopening cash covers deposits, permits, licensing, setup labor, launch marketing, professional setup, and cleaning. Working-capital controls use 0 receivable days, 7 payable days, and 7 inventory days.
The Capital Expenditure Plan schedules restaurant assets, purchase dates, depreciable status, and depreciation. It keeps durable investment separate from operating expenses.
Initial owner funding is $482,985 in the illustrated case. It covers durable assets, distinct preopening payments, opening working capital, and three months of first-year operating outflows; no committed outside financing is assumed.
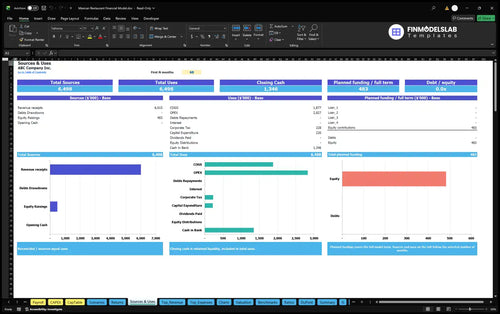
The Sources and Uses of Funds report reconciles funding sources with restaurant cash uses, including operations, investment, debt, equity, and retained cash. It supports funding review without treating EBITDA as cash.
The illustrated base case grows revenue from $978,089 in 2026 to $1,439,675 in 2030 while EBITDA rises from $147,402 to $374,358.
| Year | Revenue | Operating Expenses | EBITDA |
|---|---|---|---|
| 2026 | $978,089 | $830,687 | $147,402 |
| 2027 | $1,084,888 | $872,762 | $212,125 |
| 2028 | $1,197,313 | $943,652 | $253,660 |
| 2029 | $1,315,350 | $1,003,306 | $312,043 |
| 2030 | $1,439,675 | $1,065,317 | $374,358 |
Illustrative projections rounded to whole dollars.
Revenue growth reflects higher guest demand and annual menu pricing, while expenses rise through ingredients, sales-linked spending, rent, and staffing. EBITDA is an operating measure, not net profit or available cash.
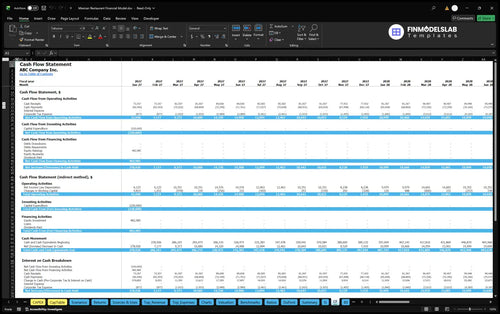
The Cash Flow Forecast shows operating, investing, and financing cash movements with an opening-to-closing cash reconciliation. Use it for liquidity review because EBITDA excludes asset purchases and financing flows.
Returns and scenario tools help test cost coverage, liquidity timing, recovery of invested capital, and operating resilience when assumptions change.
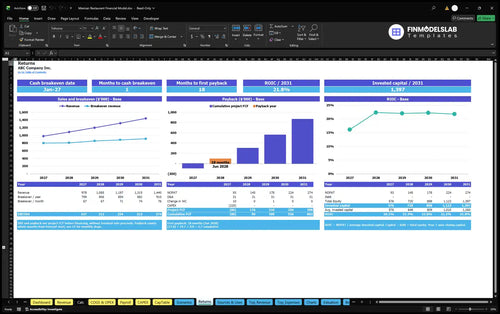
Returns separates sales break-even, cash break-even timing, investment payback, and annual ROIC. No payback month, ROIC result, IRR, or valuation amount is stated because the supplied restaurant case does not document those outputs.
The Return on Invested Capital Analysis combines break-even, free cash flow, payback, invested capital, and annual ROIC. It evaluates investment returns without substituting EBITDA for cash-based measures.
Dashboard Scenario Controls apply Low, Base, and High multipliers to revenue, COGS, variable expenses, fixed expenses, and payroll for comparative profitability analysis.
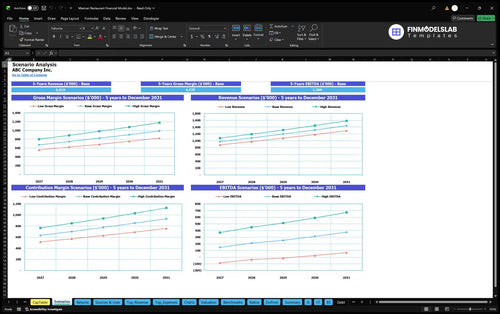
The Financial Scenario Analysis compares Low, Base, and High revenue, gross margin, contribution margin, and EBITDA. It shows how changes in demand and costs alter restaurant profitability.
The template is designed for an independent U.S. Mexican restaurant with one guest-demand pool, six menu categories, table service, direct pickup, and a small bar.
The illustrated format assumes an 80-seat, 2,800-square-foot leased second-generation location and excludes franchise fees, delivery marketplaces, catering, and ticket income. Buyers with different channels can update the operating assumptions.
Guest demand, menu prices, mix, staffing, costs, startup investment, working-capital days, equity, debt, and scenario multipliers are editable for a specific plan.
These answers summarize the main mechanics and boundaries of the restaurant template.
It multiplies paid guest visits by 2.3 items per guest, applies seasonality, allocates items across six categories, and multiplies each category by its annual net price.
Yes. Category shares and annual prices are editable, with the final category share calculated as the residual needed to reach 100%.
Yes. Payroll is planned separately by role using annual-average FTE, active months, and fixed annual base salary per FTE.
No. Startup assets, preopening cash, working capital, and funding are modeled separately from annual operating expenses and EBITDA.
Yes. The workbook includes projected Cash Flow and Balance Sheet reports, but this description does not invent statement values absent from the documented case.
Yes. Low, Base, and High controls can adjust revenue, COGS, variable expenses, fixed expenses, and payroll.
Returns includes sales break-even, cash break-even timing, investment payback, and annual ROIC, without claiming a specific result until the workbook is completed.
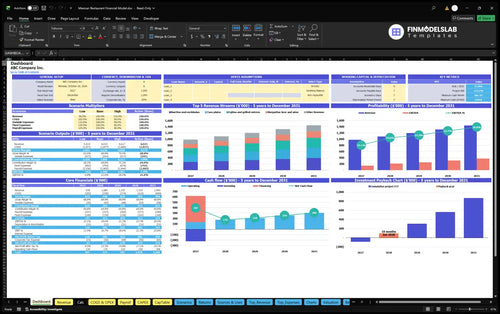
KPIs, forecasts, and cash flow at a glance.
Key assumptions and calculations driving revenue forecasts.
Funding sources, spending, and closing cash.
Cash break-even, payback, and ROIC.
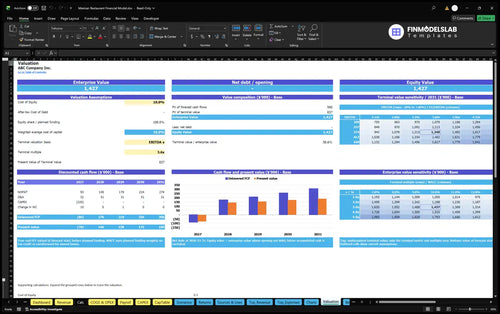
DCF valuation and sensitivity analysis.
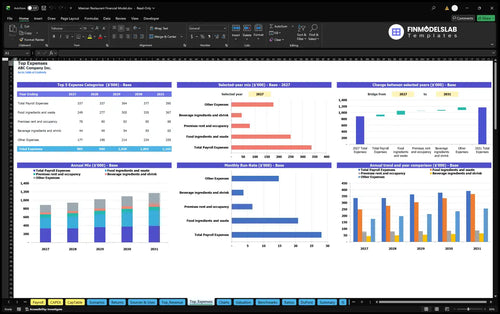
Largest costs and spending trends.
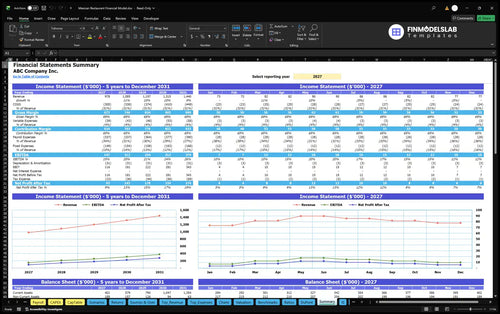
Annual and monthly financial performance.
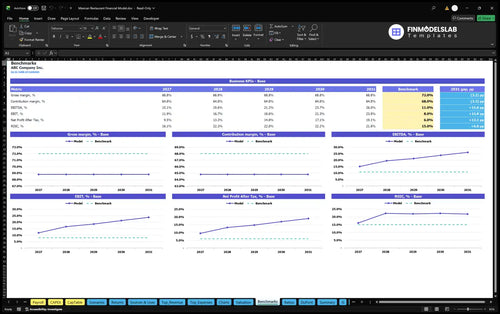
Compare margins and returns to benchmarks.

I finally knew what investors wanted to see, so I spent less time guessing and more time planning the raise. It saved me a full day of back-and-forth on the deck.

I could edit the model without worrying that one broken cell would throw everything off. That saved me hours of checking and gave me a cleaner file to share.
Switching between low, base, and high cases was quick instead of tedious. I built all three forecasts in one sitting and had the numbers ready for a meeting the same day.