

Revenue and Calc
Edit leads, conversion, monthly seasonality, class allocations and prices; monthly calculations convert these inputs into vehicle sales and revenue.


The Used Motorcycle Dealership Financial Model is an Excel planning template for an independent Dallas–Fort Worth used-motorcycle showroom. Its 2026–2030 example projects sales from qualified buyer leads, conversion, monthly seasonality, riding-class mix and selling prices, then deducts vehicle and dealership operating costs.
The case uses owned inventory and outsourced reconditioning, excluding OEM franchises, consignment, repair sales, parts sales and F&I commissions. Its operating example ends at EBITDA; separate reports analyze cash flow, financing and investment returns.
The template connects dealership operating assumptions with monthly calculations, financial reports, financing schedules and integrity checks.
Edit leads, conversion, monthly seasonality, class allocations and prices; monthly calculations convert these inputs into vehicle sales and revenue.
Model vehicle acquisition, auctions, reconditioning, freight, warranties, sales incentives, advertising and showroom expenses in their appropriate direct, variable and fixed cost categories.
Plan 4.5 annual-average staff FTE and base compensation by role. Schedule durable showroom investments separately from vehicle inventory, with supporting asset and depreciation calculations.
Record equity, optional debt and working-capital controls; review reconciliation checks for funding, cash and scenario consistency.
Review financial statements, the Dashboard, Low/Base/High scenarios, break-even, Returns, valuation, ratios and revenue or expense composition.
Projected sales come from converted qualified buyer leads, adjusted by monthly seasonality and allocated once across five motorcycle classes.
Buyer leads rise from 300 monthly in 2026 to 520 in 2030, with 10% conversion. Repeating seasonal factors range from 0.75 in January to 1.20 in April and May.
Sales divide into cruiser 30%, sport 20%, touring 15%, adventure 20% and standard 15%. Each transaction belongs to exactly one class, avoiding duplicate unit sales.
The Revenue Forecast combines buyer leads, conversion rates, month-by-month seasonality, motorcycle sales mix and realized prices into annual sales volumes and revenue. Its inputs feed the separate monthly Calc schedule.
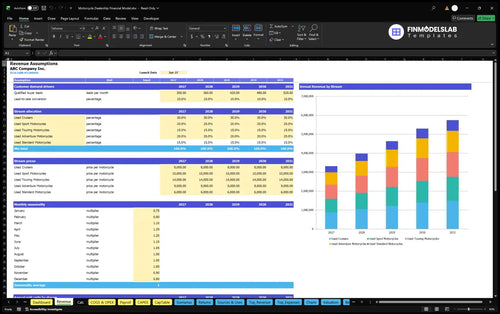
300 monthly leads × 10% close rate × 12.0 summed seasonal factors = 360 motorcycles; 360 motorcycles × $9,200 weighted class price = $3,312,000 annual revenue.
| Riding class | Sales mix | Price per bike |
|---|---|---|
| Cruiser | 30% | $8,000 |
| Sport | 20% | $10,000 |
| Touring | 15% | $14,000 |
| Adventure | 20% | $9,000 |
| Standard | 15% | $6,000 |
Mix shares and selling prices are estimated inputs; the standard class is the residual allocation.
The January 31, 2026 launch month counts as a full month; prelaunch revenue is zero. Inventory holding and staffing are planning constraints, not alternative sales-volume ceilings.
Vehicle-related costs scale with sales revenue, while selling expenses are rate-based and fixed showroom expenses and staff base pay form the recurring operating cost base.
Motorcycle acquisition and auction fees consume 78% of revenue. Reconditioning supplies add 1.5%, outsourced labor 2%, transport 0.7% and warranty remedies 1%, totaling 83.2% COGS.
Variable costs total 2.9% of revenue: incentives 1.5%, advertising 1% and transaction processing 0.4%. Fixed expenses include a $6,000 monthly showroom lease, insurance, utilities, dealer systems, security and administration.
The COGS and Operating Expense Forecast separates purchase and reconditioning costs from selling incentives and monthly showroom overhead. It shows how cost percentages and effective dates flow into projected operating margins.
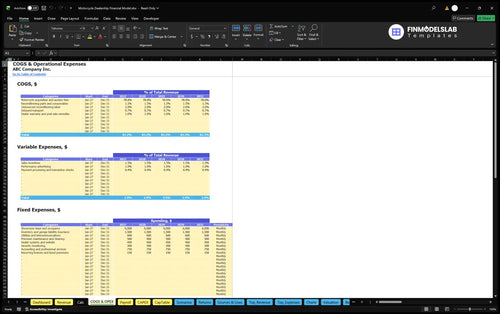
| Expense group | Driver | 2026 | 2030 |
|---|---|---|---|
| COGS | 83.2% of sales | $2,755,584 | $4,776,346 |
| Variable expenses | 2.9% of sales | $96,048 | $166,483 |
| Fixed expenses | Monthly fixed costs | $123,000 | $123,000 |
| Payroll | Fixed base salaries | $193,000 | $193,000 |
Forecast inputs and amounts are illustrative; 2030 amounts are rounded to whole dollars.
The Payroll Forecast allocates salaries and annual-average staffing FTE by role, with monthly personnel calculations and hiring controls. It keeps fixed employee base pay separate from outsourced reconditioning labor and sales-based incentives.
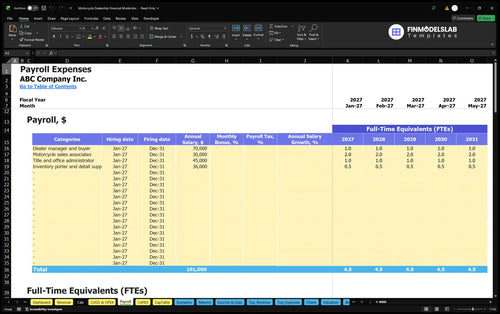
Staffing includes one manager-buyer, two sales associates, one administrator and 0.5 FTE porter. Their annual base pay per FTE is $70,000, $30,000, $45,000 and $36,000 respectively; payroll taxes and benefits are excluded.
Opening cash requirements cover showroom setup, inventory purchases and liquidity reserves separately from the annual EBITDA forecast.
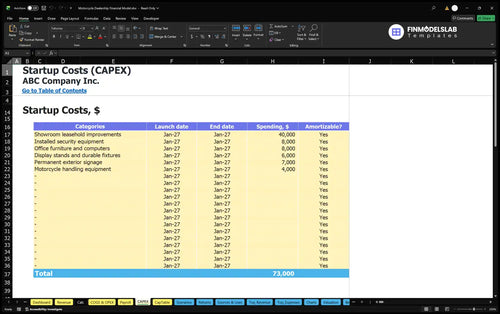
Startup assets include $40,000 leasehold improvements, $8,000 security equipment, $8,000 furniture/computers and $6,000 display fixtures, plus signage and handling equipment. Deposits, legal setup, opening marketing and preopening staff are separate cash uses.
The Capital Expenditure Plan schedules durable dealership asset purchases and depreciation. It distinguishes investments in the physical showroom and equipment from the acquisition costs of motorcycles held for resale.
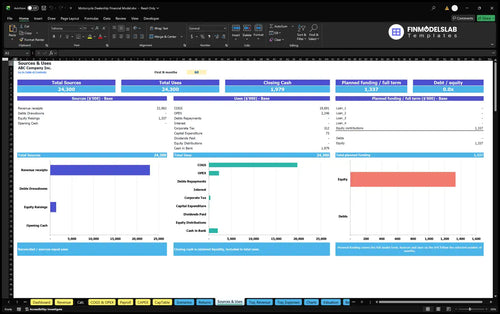
Estimated owner funding is $1,337,236 for startup needs, opening material stock and three months of recurring operating cash outflows. No committed debt or grants are assumed.
Sources and Uses of Funds reconciles proposed equity, optional borrowing and the allocation of funds to operations, investment and retained cash. This report helps distinguish opening financing needs from the dealership’s forecast operating earnings.
Working-capital inputs are zero receivable days, zero payable days and 57 inventory days, approximating 60 physical holding days adjusted for the material share of COGS. Day controls alone do not establish cash sufficiency.
The example projects a demand-led increase in motorcycle sales with percentage-based costs and unchanged annual fixed and base payroll assumptions.
| Year | Revenue | Operating Expenses | EBITDA |
|---|---|---|---|
| 2026 | $3,312,000 | $3,167,632 | $144,368 |
| 2027 | $3,974,400 | $3,737,958 | $236,442 |
| 2028 | $4,636,800 | $4,308,285 | $328,515 |
| 2029 | $5,299,200 | $4,878,611 | $420,589 |
| 2030 | $5,740,800 | $5,258,829 | $481,971 |
Illustrative scenario, not historical dealership results; independent rounding can produce small displayed differences.
The 2026 case produces $144,368 EBITDA on $3,312,000 of sales. By 2030, monthly leads reach 520, revenue $5,740,800 and EBITDA $481,971, with fixed overhead and base payroll unchanged.
EBITDA margin rises from about 4.4% in 2026 to 8.4% in 2030. Net profit and cash flow additionally reflect depreciation, financing, tax and investment considerations.
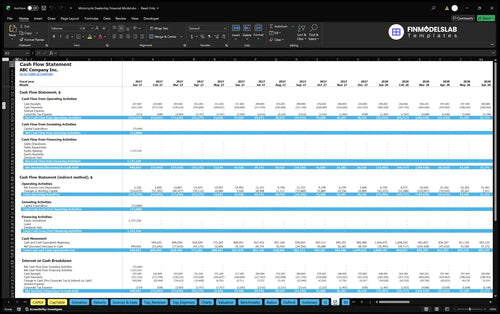
The Cash Flow Forecast reports projected operating, investing and financing cash movements and reconciles opening with closing cash. It can reveal the timing effects of owned-bike inventory, capital purchases and financing that EBITDA does not measure.
The workbook supports operating break-even, cash break-even, investment payback and annual ROIC as distinct calculations rather than interchangeable profitability measures.
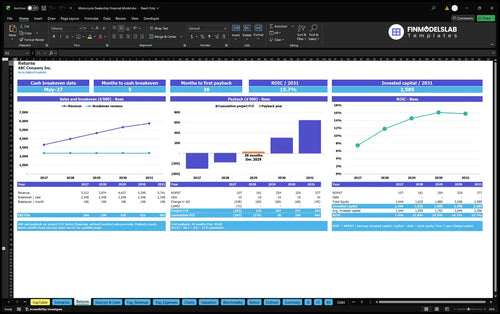
Sales break-even compares revenue with operating costs; cash break-even evaluates cash requirements. Payback uses cumulative project free cash flow, while annual ROIC relates returns to invested capital. EBITDA alone does not establish these results.
The Returns analysis presents break-even requirements, project cash flow, investment payback and annual ROIC. Its schedules help assess when the modeled business covers operating costs and when invested capital might be recovered.
Dashboard Low/Base/High scenarios vary revenue, COGS, variable costs, fixed costs and payroll. Valuation sensitivity and optional debt schedules are available, but the example establishes no payback date, ROIC, IRR, valuation or approved borrowing.
This example is designed for owners, buyers and investors analyzing a lead-driven independent used-motorcycle dealership with purchased inventory.
Dealers can test whether leads, conversion and category pricing support showroom costs. Buyers and investors can compare acquisition margins against payroll, opening stock and equity needs.
OEM franchises, consignment, repairs and F&I operations require additional revenue and cost structures not included here.
Answers about the model’s operating scope, editable assumptions and financial reports.
It models dealer-owned used motorcycles in five riding classes, not an OEM-franchised new-bike business or a consignment operation.
Qualified buyer leads are multiplied by the assumed close rate and monthly seasonality, then transactions are assigned once to the five motorcycle classes.
Yes. Each category has its own selling price, and standard motorcycles receive the residual share after the other four class allocations.
COGS covers acquisition and auction fees, reconditioning materials and outsourced labor, inbound transport, and warranty or post-sale remedies.
No. Fixed base staff pay is planned in Payroll; outsourced reconditioning labor belongs to COGS, while sales incentives are separate variable expenses.
No. The example uses an estimated $1,337,236 owner contribution for startup uses, inventory and operating reserve, with no committed debt.
No. EBITDA is operating earnings before depreciation, interest and taxes; separate financial statements address cash movements and net income.
The Returns worksheet supports these analyses, but the supplied example does not establish actual investment payback timing, ROIC figures or cash sufficiency.
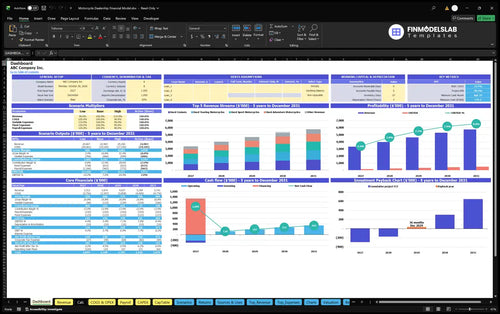
KPIs, forecasts, and cash flow at a glance.
Key assumptions and calculations driving revenue forecasts.
Funding sources, spending, and closing cash.
Cash break-even, payback, and ROIC.
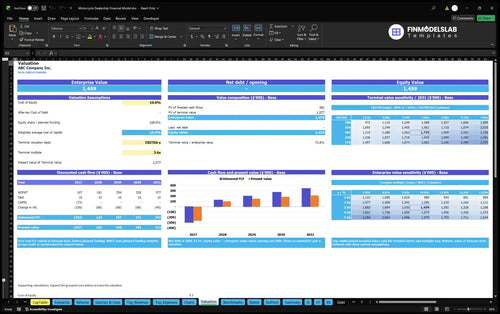
DCF valuation and sensitivity analysis.
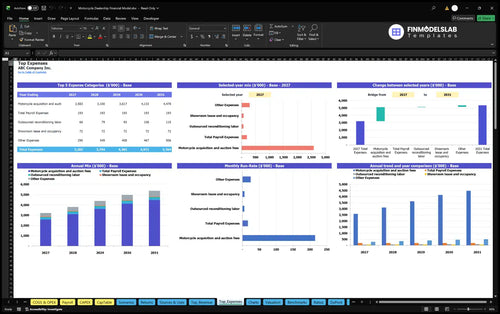
Largest costs and spending trends.
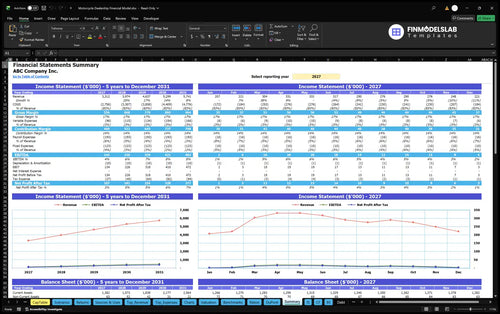
Annual and monthly financial performance.
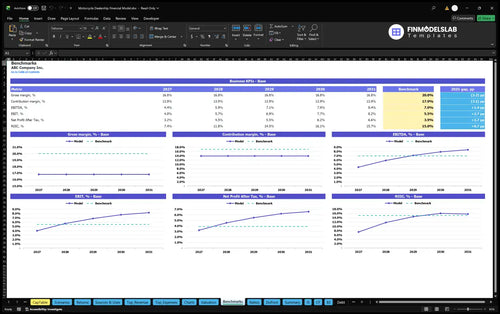
Compare margins and returns to benchmarks.

I stopped hunting through scattered files for statements and charts. Having everything in one workbook cut our reporting prep by hours and made the lender update much easier to share.

Setting up low, base, and high cases used to take forever. This template let me compare all three in one pass, so I booked a planning meeting the same day.
I’m not deep into Excel, so advanced modeling usually slows me down. The clear layout and built-in formulas helped me finish the model without hiring help.