

Revenue and Monthly Calculations
Revenue sets the weekend ticket pool, six ticket tiers, pricing, and July activity. Calc converts those inputs into a monthly forecast and annual admission totals.


The Music Festival Financial Model is an Excel template for planning one two-day outdoor U.S. music festival held each July. It converts a single 6,000-place weekend capacity, six exclusive admission categories, ticket prices, and attendance assumptions into monthly revenue, operating expenses, and EBITDA projections for 2026–2030.
The example describes a regional leased festival site in the Mid-Atlantic, without signed site or artist contracts. It excludes sponsorships, owned concessions, camping, and merchandise; its operating assumptions and illustrated earnings are planning estimates, not actual results.
The linked Excel worksheets connect festival-specific admissions and commitments to financial reporting, funding schedules, and decision checks.
Revenue sets the weekend ticket pool, six ticket tiers, pricing, and July activity. Calc converts those inputs into a monthly forecast and annual admission totals.
COGS & OPEX separates rights royalties, payment fees, and fixed event commitments. Payroll builds staffing by annual-average FTE, role salary, and effective dates.
CAPEX tracks reusable equipment and depreciation. CapTable records contributions; Dashboard debt controls and Debt provide optional financing schedules.
IS, CF, and BS report accounting results, cash movements, and financial position. Summary and Dashboard combine selected outputs for management review.
Scenarios, Returns, Top_Revenue, Top_Expenses, and Charts examine sensitivity, break-even, revenue mix, and cost drivers. Checks flags inconsistent inputs and reconciliations.
Admission revenue comes from one shared pool of weekend wristbands, multiplied by utilization, ticket allocations, and each tranche’s price.
Every pass covers both days. The mix is 30% early-bird GA, 35% standard GA, 15% final-release GA, 12% VIP, 3% patron hospitality, and 5% group GA.
For 2026, 65% occupancy means 3,900 weekend wristbands at a $214.75 weighted pass price. Each sale draws from the same venue capacity.
The Revenue Forecast combines weekend capacity, ticket-tier shares, prices, and annual utilization into admissions by tranche. Its annual inputs feed Calc, which assigns recognized festival ticket revenue to July.
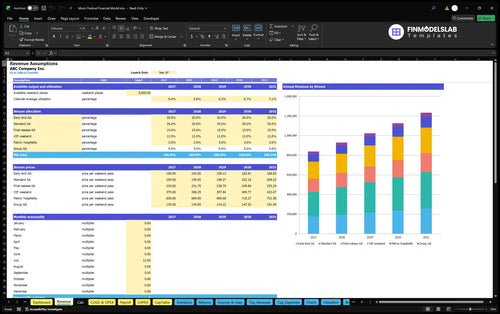
6,000 weekend places × 65% utilization × $214.75 weighted pass price = $837,525 annual revenue.
The model uses approximately 5.42% calendar-average utilization multiplied by 12 in July, with zero activity in other months. By 2030, 7.08% calendar-average utilization represents roughly 85% event occupancy.
Ticket prices rise over five forecast years while shares stay fixed. Independent concession vendors keep their sales; food and beverage revenue is excluded.
The forecast counts each expense once across percentage-based direct costs, variable payment fees, fixed event commitments, and salaried staff.
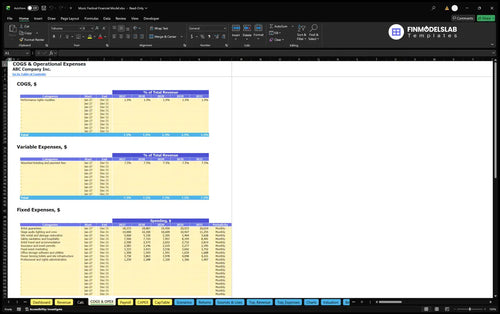
Performance-rights royalties are modeled at 1.5% of revenue as COGS. Absorbed ticketing and payment fees add 7.5% as variable operating expenses; together those two rates scale directly with gross admissions.
Fixed costs cover artist guarantees, stage production, site rental, security, sanitation, travel, insurance, permits, marketing, infrastructure, and administration. The 2026 total is $663,000, excluding payroll.
The COGS and Operating Expenses forecast separates revenue-linked royalties and ticket fees from fixed event commitments. It shows which costs persist when admissions fall.
| Expense category | Amount | Calculation basis |
|---|---|---|
| COGS | $12,563 | 1.5% of revenue |
| Variable expenses | $62,814 | 7.5% of revenue |
| Fixed expenses | $663,000 | Event commitments |
| Payroll | $125,000 | Role-based salaries |
Total 2026 operating expenses are $863,377 before rounding differences.
The artist-guarantee input alone is approximately $18,333 per month for 12 paid months in 2026, approximately $220,000 annually. Spreading a fixed commitment across months is a planning convention; it is not evidence of a signed contract or actual payment dates.
Annual-average staffing is 1.0 festival director FTE at $70,000, 0.5 marketing coordinator FTE at $50,000 per FTE, and 0.5 operations coordinator FTE at $60,000 per FTE.
The Payroll Forecast converts staffing FTE and salaries into personnel expense. The case totals $125,000 in annual base salaries, excluding employer taxes and benefits, and keeps payroll separate from fixed event costs.

The festival starts with owner equity for reusable assets, a refundable site deposit, and a cash reserve, all separate from annual EBITDA.
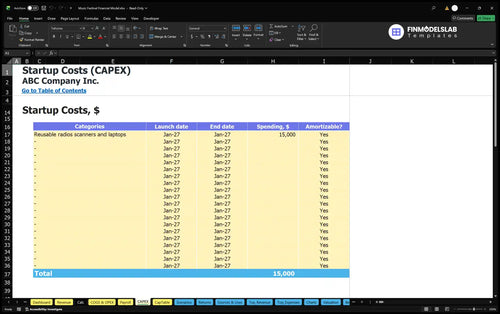
The opening plan assigns $15,000 to reusable radios, scanners, and laptops; $15,000 to a refundable site-damage deposit; and $215,844 to a three-month reserve. These components sum to $245,844 of planned initial owner funding, with no external debt in the example.
The Capital Expenditure Plan schedules reusable festival equipment and tracks depreciation or non-depreciable spending where applicable. Its investment entries are distinct from the event’s percentage-based and fixed operating expenses.
Receivable, payable, and inventory days are zero in the example. Actual presales, refundable amounts, vendor deposits, and contract milestones may require different cash-flow timing.
The Sources and Uses of Funds report reconciles funding received with operating, investment, and financing cash uses over a chosen period. It helps compare the owner contribution and planned spending, but the stated three-month reserve does not prove peak cash sufficiency.

With the documented pricing, utilization, and operating costs, the example moves from negative EBITDA in 2026 to positive EBITDA beginning in 2027.
| Year | Revenue | Operating Expenses | EBITDA |
|---|---|---|---|
| 2026 | $837,525 | $863,377 | -$25,852 |
| 2027 | $929,009 | $891,501 | $37,508 |
| 2028 | $1,025,225 | $920,647 | $104,578 |
| 2029 | $1,126,373 | $950,852 | $175,521 |
| 2030 | $1,232,694 | $982,155 | $250,540 |
Forecast figures are illustrative and rounded to the nearest whole dollar; displayed totals may differ slightly.
In 2026, $837,525 of revenue trails $863,377 of expenses, yielding negative EBITDA of $25,852. EBITDA reaches $37,508 in 2027 and $250,540 in 2030 as utilization and pricing increase.
These are forecast operating earnings before interest, taxes, depreciation, and amortization, not after-tax profit. The example results stop at EBITDA; no observed net income, cash balance, or tax liability is established by these figures.
The Cash Flow Forecast separates operating receipts and payments from equipment purchases, equity funding, borrowing, and debt service. It allows a monthly liquidity review around the July festival; EBITDA alone cannot establish available cash or funding adequacy.

Returns and scenarios evaluate break-even, payback, and sensitivity to attendance and event commitments, without implying guaranteed results.
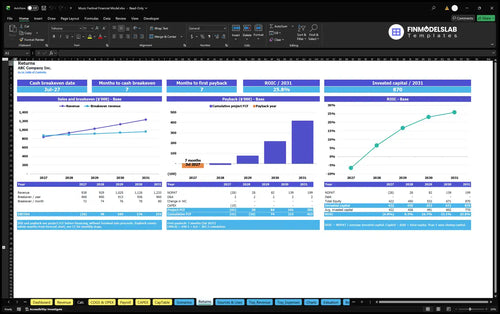
Sales break-even estimates revenue needed to cover costs. Cash break-even tests cash-recovery timing, payback tracks cumulative project cash flow, and annual ROIC relates returns to invested capital.
The EBITDA table establishes none of these outcomes. Positive operating earnings do not prove that owner capital has been repaid.
The Returns report distinguishes sales break-even, cash break-even, payback, and ROIC. Its calculations relate upfront investment and subsequent cash flows to different recovery measures.
Dashboard Scenario Controls vary revenue, COGS, variable costs, fixed costs, and payroll across Low, Base, and High cases. Scenarios compares margins and EBITDA; Debt and Valuation offer additional analysis.
Organizers, producers, and backers can compare one annual event. Verify venue, artist, insurance, permit, and settlement terms before using these planning estimates.
These answers clarify the documented example’s scope and how to interpret the Excel template.
No. All six admission categories share the same 6,000 weekend places, and their allocations sum to 100%.
Yes. Change tier prices, ticket allocations, and utilization assumptions in Revenue to update the admissions forecast.
No. The illustrated case is one two-day July festival, and every wristband admits the same full weekend.
No. The example forecasts admission revenue only; independent concession vendors retain their own sales.
The 2026 example has fixed artist, production, site, and staffing commitments that exceed admission revenue at its opening-year attendance level.
No. EBITDA excludes depreciation, interest, and taxes; the provided example does not establish net earnings.
No. The $215,844 reserve is a planning input; check monthly cash timing and funding requirements using Cash Flow and Sources & Uses.
Yes. Dashboard debt controls and the Debt schedule support financing assumptions, although this example assumes owner funding and no external borrowing.

KPIs, forecasts, and cash flow at a glance.
Key assumptions and calculations driving revenue forecasts.
Funding sources, spending, and closing cash.
Cash break-even, payback, and ROIC.
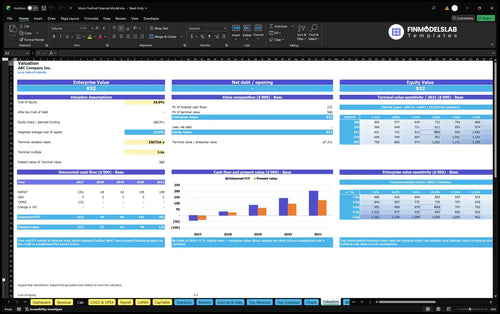
DCF valuation and sensitivity analysis.
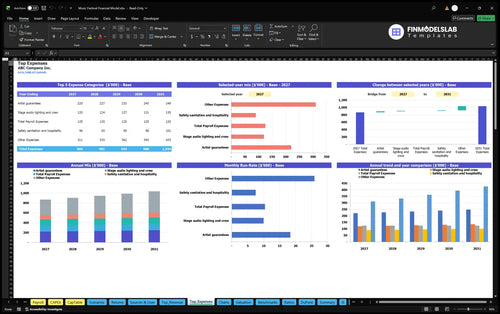
Largest costs and spending trends.
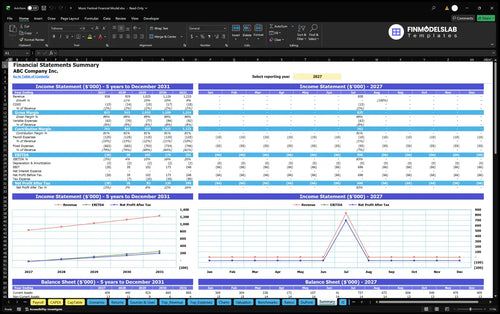
Annual and monthly financial performance.

Compare margins and returns to benchmarks.

This template showed me exactly what investors expect, so I stopped guessing at structure and outputs. It helped me present a cleaner story and get a meeting booked faster.

I’m not deep in Excel, and this was still easy to work through without getting lost in formulas. The layout made the assumptions clearer and saved me from hiring someone just to explain the sheet.
Building the projections by hand would have taken me all week, but this template got it done in a few hours. I was able to move on to planning the event instead of fighting the spreadsheet.