

Revenue & Calc
Edit monthly website traffic, checkout conversion, item retention, five apparel prices and category mix; Calc turns those assumptions into monthly revenue.


Online Clothing Store Financial Model is an editable Excel template for forecasting sales, expenses, staffing, and funding for a U.S. owned-inventory apparel retailer selling through its own website. It builds monthly calculations and annual financial projections from 2026 through 2030.
The illustrated setup uses one prepaid online checkout demand pool, five nonoverlapping apparel categories, and a leased fulfillment unit without a storefront or manufacturing. Its example results are planning assumptions, not industry averages or guaranteed outcomes.
An apparel-specific monthly operating build connects to financial statements, funding schedules and investment analysis.
Edit monthly website traffic, checkout conversion, item retention, five apparel prices and category mix; Calc turns those assumptions into monthly revenue.
Separate merchandise and shipping expenses, variable marketing and payment fees, fixed overhead, and role-based staffing costs without double-counting salaries.
Schedule startup asset purchases, owner equity, working-capital timing and optional debt facilities independently of operating sales.
Linked Income Statement, Cash Flow, Balance Sheet and Summary reports show different dimensions of the modeled financial position.
Dashboard scenario controls, break-even and return reports, valuation sensitivities, and KPI comparisons help examine planning alternatives.
Sales follow monthly qualified sessions, paid checkout conversion, items per order, retained-item share, seasonality and category prices.
The model starts with 40,000 monthly sessions and 2% checkout conversion in 2026, increasing to 100,000 sessions and 2.4% in 2030. Each purchase contributes 1.5 items before the 85% retained-item factor; those net items are allocated once across five categories.
The Revenue Forecast translates site traffic, conversion rates, items per order, retained share, seasonality and item mix into monthly sales by category. Its year-linked assumptions let you test demand changes without counting accessories as a second purchase stream.
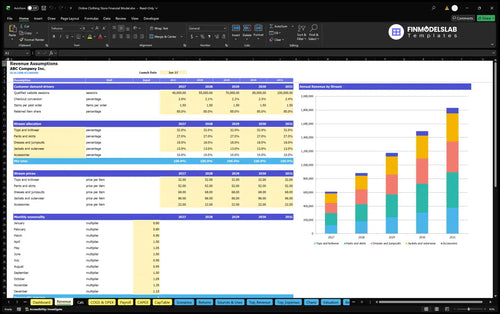
| Apparel category | Share of items | Price per item |
|---|---|---|
| Tops and knitwear | 32% | $32 |
| Pants and skirts | 27% | $52 |
| Dresses and jumpsuits | 18% | $68 |
| Jackets and outerwear | 13% | $86 |
| Accessories | 10% | $22 |
The five allocations total 100% of retained items; their blended unit price is $49.90.
40,000 sessions × 2% conversion × 1.5 items per order × 85% retained × $49.90 blended price = $50,898.
The twelve monthly seasonality factors total 12, producing $610,776 of revenue across 2026. November uses a 1.35 multiplier, shifting the monthly timing of purchases without creating a second demand pool.
Merchandise, delivery, marketing, payment fees, occupancy and staffing determine operating expenses and EBITDA.
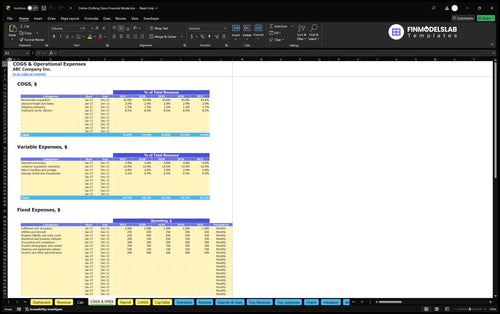
Direct costs apply 43% for purchased merchandise, 2% inbound freight and duties, 1.5% packaging, and 8.5% outbound shipping to revenue. Separately, variable operating costs apply 4% processing, 12% customer acquisition, 2% return handling, and 0.5% damage, shrink and chargebacks.
The COGS and Operating Expenses forecast schedules merchandise and logistics costs separately from variable selling expenses and monthly fixed overhead. Fixed lines include the fulfillment lease, utilities, insurance, software, accounting, photography, maintenance and office administration.
| Expense group | Input basis | 2026 | 2030 |
|---|---|---|---|
| COGS | 55% of revenue | $335,927 | $1,007,780 |
| Variable OPEX | 18.5% of revenue | $112,994 | $338,981 |
| Fixed OPEX | Monthly fixed inputs | $40,200 | $40,200 |
| Payroll | FTE × annual pay | $110,500 | $180,000 |
Groups are distinct; rounding can change displayed totals by a dollar.
The $1,500 monthly fulfillment-unit rent is included in $40,200 of annual fixed costs, not added again. All salaries are booked in Payroll; employer taxes, benefits and personal taxes are excluded from this example.
The Payroll Forecast applies annual-average FTE and fixed salary by role, then feeds monthly personnel costs to the operating forecast. The owner-manager remains at 1.0 FTE, while fulfillment staffing increases from 0.75 to 2.0 and customer service from 0.5 to 1.0.
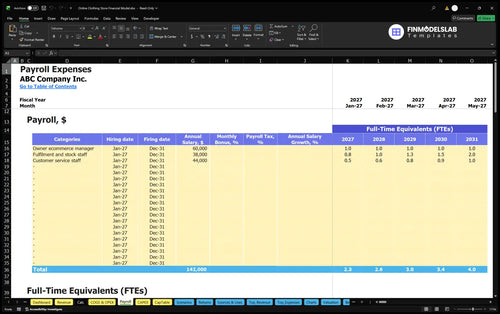
Selected annual salaries are $60,000 for the owner-manager, $38,000 per fulfillment FTE and $44,000 per customer-service FTE. Under the stated staffing assumptions, payroll increases from $110,500 in 2026 to $180,000 in 2030.
Opening equipment, inventory, cash reserve and working-capital timing are kept separate from operating earnings.
The Capital Expenditure Plan records $8,000 in storage racks and packing stations, $5,000 in computers, printers and security equipment, and $2,000 in photography equipment. It schedules $15,000 of durable opening assets and the applicable depreciation separately from recurring operating costs.
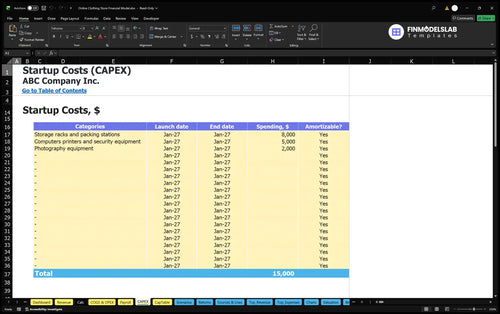
Other opening cash is $17,000 for deposits, website and launch preparation, registrations and setup labor. Initial stock is $46,687, with $149,905 modeled as a cash reserve for three first-year months of outflows; these uses are not EBITDA expenses.
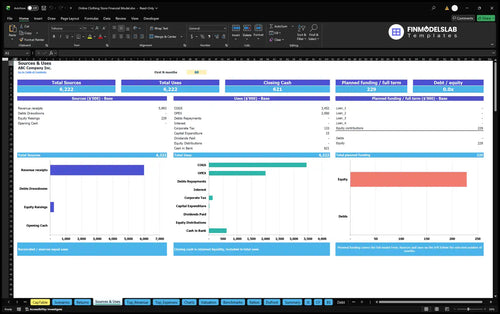
The Sources and Uses of Funds report separates owner contributions and optional debt inflows from opening assets, inventory, other outlays and cash retained. The illustrative $228,592 owner funding input assumes no committed outside funding; it is not operating sales revenue.
The five-year planning case summarizes projected annual sales, operating expenses and EBITDA in U.S. dollars.
| Year | Revenue | Operating expenses | EBITDA |
|---|---|---|---|
| 2026 | $610,776 | $599,620 | $11,156 |
| 2027 | $881,808 | $812,729 | $69,079 |
| 2028 | $1,175,744 | $1,044,872 | $130,872 |
| 2029 | $1,492,584 | $1,293,849 | $198,735 |
| 2030 | $1,832,328 | $1,566,961 | $265,367 |
Planning projections, not observed performance. Figures are rounded independently to whole dollars.
Revenue rises from $610,776 in 2026 to $1,832,328 in 2030 as modeled website sessions and conversion increase. EBITDA rises from $11,156 to $265,367 after direct, variable, fixed and payroll costs, but before depreciation, financing expenses and taxes.
The 2026 EBITDA margin is approximately 1.8%, compared with 14.5% in 2030. This illustrates operating sensitivity to demand and staffing costs; it does not establish net profit, owner distributions or cash available to spend.
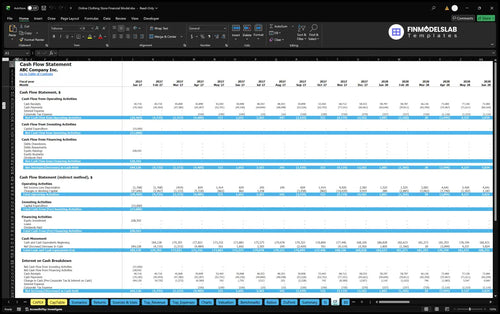
The Cash Flow Forecast shows receipts and payments by operating, investing and financing activity, with an opening-to-closing cash reconciliation. Use it to evaluate inventory purchases, capital spending and funding timing rather than treating projected EBITDA as spendable cash.
The workbook supports break-even, payback and annual investment-return analysis, but this case supplies no calculated payback date.
The Returns report distinguishes sales break-even, cash break-even, cumulative project cash flow, investment payback and annual return on invested capital. Each measure answers a different planning question and cannot be inferred from EBITDA alone.
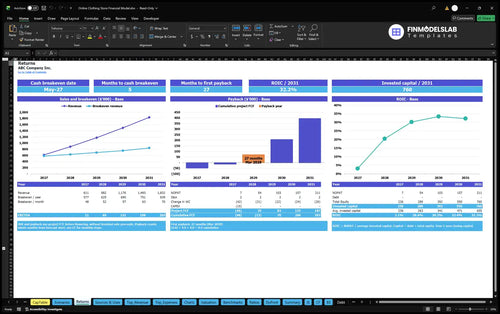
Sales break-even tests whether contribution from clothing sales can cover operating costs; cash break-even depends on cash payment and investment timing. Payback uses cumulative project cash flow, while ROIC compares returns with invested capital; no outcomes for these measures are specified here.
Dashboard scenario controls adjust revenue, COGS, variable costs, fixed costs and payroll across Low, Base and High cases. Four optional debt-facility controls and a DCF valuation sensitivity report support further analysis, but the example does not assume a loan or a valuation result.
This Excel model suits a planned or operating direct-to-consumer clothing business with owned stock.
For launch planning, change traffic or checkout conversion and trace retained sales into category revenue, gross margin and EBITDA. For operations, vary merchandise costs, advertising, fulfillment staff or occupancy expenses and compare their effects against sales growth.
For financing discussions, inspect equity contributions, optional Debt schedules, Sources & Uses, Cash Flow and Balance Sheet. Benchmark and ratio reports can compare projected metrics against reference values entered in the workbook, not independently validated apparel-industry averages.
Answers to common questions about editing assumptions and interpreting this apparel retail forecast.
Yes. The Revenue inputs cover monthly sessions, conversion, items per order, retained share, seasonality, item allocations and category prices.
No. The 85% retained-item share adjusts sold units, while the separate 2% return-handling assumption represents a variable cost.
No. The case models prepaid domestic online checkout with owned inventory and a leased fulfillment unit, not a retail storefront.
Yes. The workbook includes projected Income Statement, Cash Flow and Balance Sheet reports, although the illustrated operating figures here stop at EBITDA.
Approximately $228,592 funds opening equipment, setup costs, initial stock and the modeled reserve, with no committed outside financing in this case.
No. Returns and cash-flow reports can evaluate payback, but the supplied scenario does not establish a payback month.
No. EBITDA excludes depreciation, financing and taxes; cash flow also depends on inventory, capital purchases, working capital and funding.
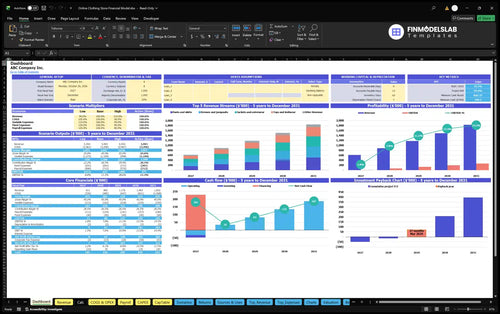
KPIs, forecasts, and cash flow at a glance.
Key assumptions and calculations driving revenue forecasts.
Funding sources, spending, and closing cash.
Cash break-even, payback, and ROIC.
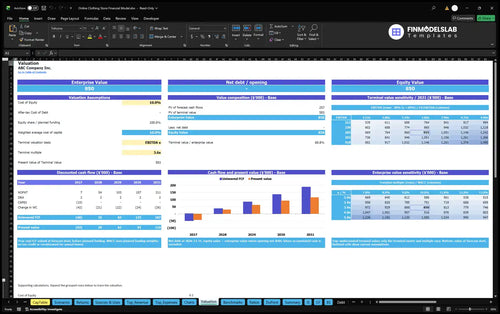
DCF valuation and sensitivity analysis.

Largest costs and spending trends.
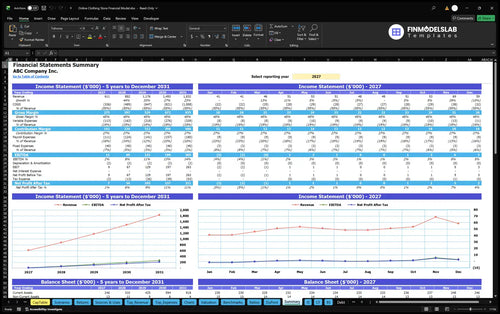
Annual and monthly financial performance.
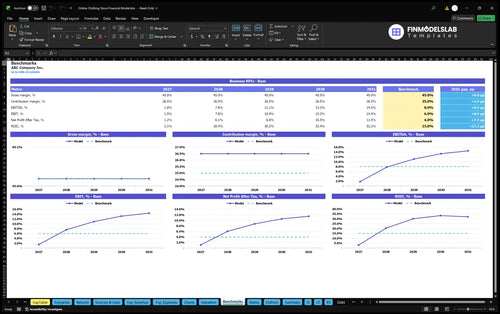
Compare margins and returns to benchmarks.

I stopped worrying that one bad cell would throw off the whole model. It saved me hours of checking and made the numbers easy to trust.
I’m not great with advanced Excel, but this template kept everything simple. I built the forecast in one afternoon without needing outside help.
The pricing, cost, and growth inputs are laid out in one place, so nothing feels scattered. I had a clearer plan for my launch numbers in under an hour.