

Revenue and Monthly Calc
Edit households, order frequency, five basket prices, sales mix, and launch timing. Revenue and Calc produce monthly sales without duplicating orders.


The Online Grocery Store Financial Model is an Excel template for an Indianapolis retailer that owns grocery inventory and delivers five curated basket formats. Buying households, order frequency, basket selection, and inclusive checkout prices drive monthly and annual financial projections.
The illustrated January 2026 launch uses a leased 3,200-square-foot food-approved unit and five owned insulated vans. Each order includes one basket, a delivery fee, and a service fee; subscriptions, commissions, pickup, sales taxes, and optional tips are excluded.
Connected worksheets turn grocery inputs into operating projections, financial statements, and funding reports.
Edit households, order frequency, five basket prices, sales mix, and launch timing. Revenue and Calc produce monthly sales without duplicating orders.
COGS & OPEX separates merchandise, spoilage, packaging, fuel, variable charges, and overhead. Payroll plans staff FTE and base pay.
CAPEX schedules equipment and vans; CapTable records equity; Dashboard debt controls feed repayments. Sources & Uses tracks funding allocation.
Income, cash flow, and balance sheet forecasts connect with Dashboard, Scenarios, Returns, Valuation, Ratios, Benchmarks, and Checks.
Households multiplied by monthly order frequency create one order pool, allocated across basket shares and prices.
For 2026, 600 buying households each place two monthly orders, creating 1,200 orders. Each is assigned to one exclusive basket format, priced to include merchandise and one delivery and service fee.
Basket shares total 100%. The model has no second fee-volume forecast or delivery-capacity ceiling: order volume follows demand, not a five-van limit.
The Revenue Forecast converts households, order frequency, basket mix, and checkout prices into sales by stream. Calc applies launch timing and consolidates monthly revenue.

| Basket format | Order share | Price / order |
|---|---|---|
| Produce and pantry | 10% | $75 |
| Weekly mixed grocery | 30% | $125 |
| Family grocery | 30% | $180 |
| Bulk pantry | 15% | $150 |
| Organic grocery | 15% | $200 |
All prices include the delivery and service fees; basket shares allocate a single order pool.
600 households × 2 orders per month × 12 months × $151.50 weighted checkout price = $2,181,600 annual revenue.
Households increase to 1,600 by 2030, with two monthly orders each. That demand assumption drives projected volume and related expenses.
Direct costs, variable charges, fixed overhead, and staff salaries are calculated separately.
Estimated COGS rates include merchandise at 67.25% of sales, spoilage at 1.34%, packaging at 1.49%, inbound freight at 0.5%, and delivery fuel at 1.32%. Expense totals reflect the full case calculations.
Variable costs cover processing at 3.1%, acquisition campaigns at 3%, and refunds at 0.5% of revenue. Fixed overhead covers occupancy, utilities, insurance, maintenance, software, sanitation, and food-safety compliance.
The COGS and Operating Expenses report separates direct, variable, and fixed spending in monthly calculations. Compare merchandise, payment fees, delivery fuel, and overhead as EBITDA drivers.
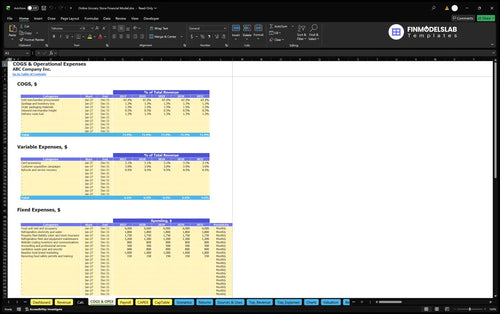
Fixed overhead totals $168,000 annually, including $6,000 monthly rent and occupancy. It excludes payroll and opening capital investment.
The Payroll Forecast schedules FTE, base salaries, hiring, and monthly personnel costs. The 2026 plan uses one manager, two fulfillment FTE, 0.5 customer-support FTE, and two driver FTE.
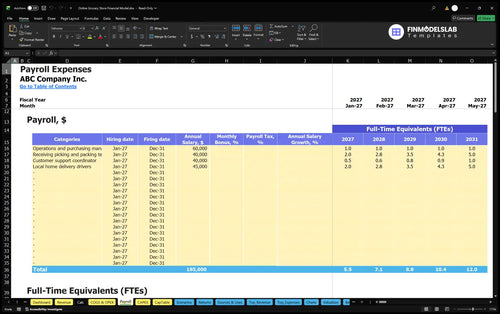
Annual bases are $60,000 per manager, $40,000 per fulfillment/support FTE, and $45,000 per driver. Payroll grows from $250,000 in 2026 to $525,000 in 2030, without duplicating salaries in COGS.
Opening funding separates fixed assets, preopening costs, inventory working capital, and reserves.
Refrigeration, monitoring, shelving, scanners, packing equipment, and five used vans make up $276,000 of durable assets. About $62,833 of other startup cash covers deposits, setup, permits, opening marketing, and training.
The Capital Expenditure Plan tracks purchases, timing, depreciation, and book value. Its vehicle and refrigeration investments remain separate from recurring operating costs.

Inventory days equal 10; receivable and payable days equal zero. Opening working capital is approximately $41,885; a separate $532,589 reserve follows three months of recurring cash outflows, not a peak-cash test.
Sources and Uses of Funds links equity and financing sources to purchases, opening costs, working capital, and retained cash. Owner contributions are funding, not revenue.
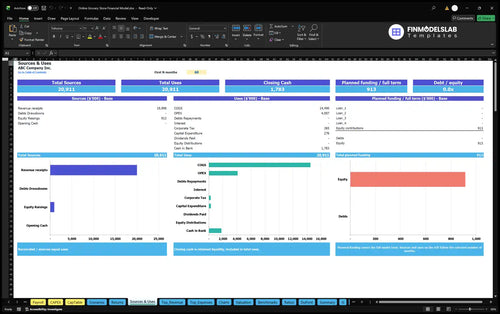
Rounded owner funding is $913,308, with no confirmed external funding. CapTable and Dashboard debt controls allow alternative funding plans; neither implies a loan approval.
The annual figures are planning projections, not historical results or industry averages.
| Year | Revenue | Operating Expenses | EBITDA |
|---|---|---|---|
| 2026 | $2,181,600 | $2,130,356 | $51,244 |
| 2027 | $3,090,600 | $2,912,587 | $178,013 |
| 2028 | $3,999,600 | $3,694,819 | $304,781 |
| 2029 | $4,908,600 | $4,477,051 | $431,549 |
| 2030 | $5,817,600 | $5,259,282 | $558,318 |
Amounts are forecasts rounded to whole dollars; individual displayed sums can differ by $1 due to rounding.
Rising household volume increases sales, with merchandise, fulfillment, marketing, and payroll absorbing costs. EBITDA grows from $51,244 in 2026 to $558,318 in 2030, before depreciation, financing, and taxes.
The Income Statement calculates accounting profit, but this example supplies no net profit amount. EBITDA excludes inventory investment, asset purchases, and financing cash movement.
The Cash Flow Forecast tracks operating, investing, and financing cash and reconciles opening to closing balances. Examine inventory, van spending, and funding timing for liquidity pressure.

Returns and scenario tools examine operating thresholds and investment decisions without guaranteeing results.
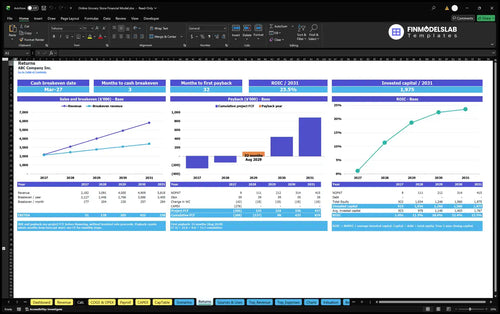
Returns separates sales break-even, cash break-even, investment payback, and annual ROIC. Sales break-even tests cost coverage; cash break-even and payback use cash flows, while ROIC relates return to invested capital.
No break-even threshold, payback date, ROIC, or IRR is asserted; those cannot be inferred from EBITDA projections alone.
The Returns report compares revenue with break-even needs and examines project free cash flow, payback, and annual ROIC. Operating coverage differs from investment recovery.
Dashboard Scenario Controls vary revenue, COGS, variable and fixed costs, and payroll across Low, Base, and High cases. Valuation uses discounted cash flow and terminal assumptions, not confirmed exit prices.
The template fits owned-inventory local delivery, not marketplaces or subscriptions.
Test household acquisition, basket pricing, delivery staffing, spoilage, and refrigeration investment. Compare EBITDA with cash flow, funding allocations, and balance sheet projections before major commitments.
No automatic picking or vehicle-route capacity limit applies. Check actual delivery windows, storage, staffing, and demand separately; the illustrated figures are estimates, not guaranteed results.
Common questions about revenue, staffing, funding, and reports.
Yes. Edit the five basket checkout prices and allocation shares; the Revenue and Calc sheets update the resulting sales forecast.
No. Each basket price already includes one delivery fee and one service fee, and each customer order enters only one basket category.
No. Driver base salaries are included only in Payroll; delivery fuel is a separate COGS assumption.
Yes. Inventory days are an editable control, while CAPEX, CapTable, Debt, and Sources & Uses support opening assets and financing analysis.
No. The displayed operating forecast ends at EBITDA; the Income Statement separately calculates depreciation, interest, tax, and net profit under the workbook assumptions.
No. The reserve follows a three-month recurring-outflow policy; review the monthly Cash Flow and Balance Sheet for possible cash shortfalls.
Yes. Dashboard Scenario Controls and Scenarios compare Low, Base, and High revenue, cost, and EBITDA assumptions without guaranteeing an outcome.
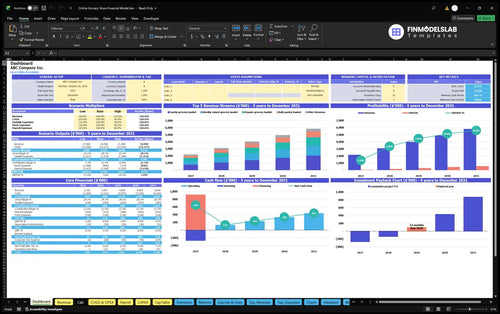
KPIs, forecasts, and cash flow at a glance.
Key assumptions and calculations driving revenue forecasts.
Funding sources, spending, and closing cash.
Cash break-even, payback, and ROIC.
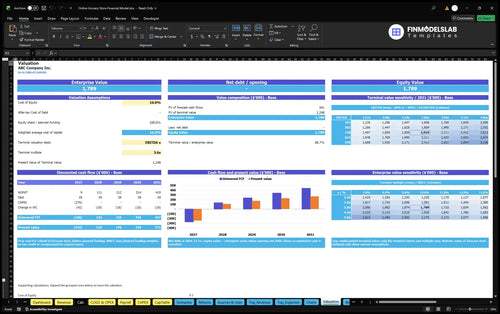
DCF valuation and sensitivity analysis.
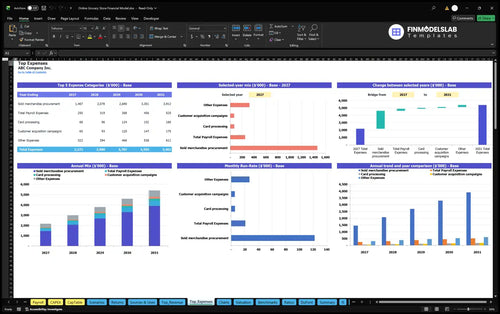
Largest costs and spending trends.
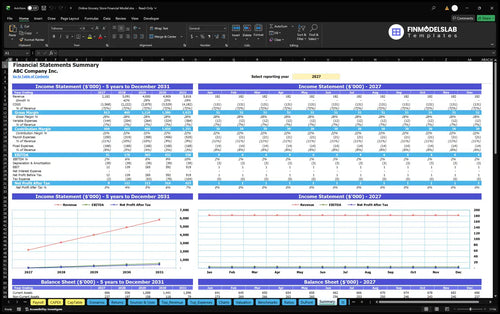
Annual and monthly financial performance.
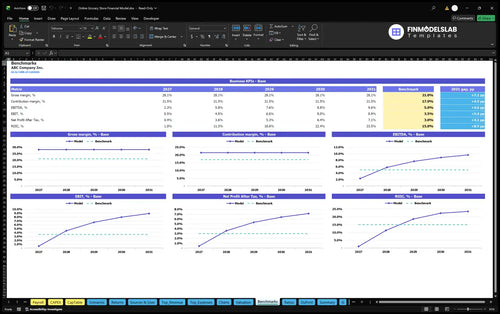
Compare margins and returns to benchmarks.

Our statements and charts were scattered across files before, and this template pulled everything into one clean model. It saved me about 4 hours a week when I had to update reports for our lender.
I’m not deep into Excel, so I appreciated how the assumptions and formulas were laid out in plain language. I built the grocery store forecast without hiring a modeler, and that was a relief.

This made it much easier to see runway and spot shortfalls before they became a problem. We booked a planning meeting with our partner after the first cash-flow run because the numbers were finally clear.